
While browsing the r/OttawaSenators sub-reddit, I came upon a post quoting Bruce Garrioch. It read:
‘Sens coach Travis Green tells OverDrive1050 that “there has been a lot of talk about offence around our team for a bit now” but noted they still rank well in expected goals. “We’ve been pretty good offensively and the puck just isn’t going in the net.”’
This allowed me to take a look at the Senators’ offense, focusing on expected goals. Not because I like expected goals, but because Coach Green talked about it.
Expected Goals
Expected goals is one of my favourite statistics. It is an estimate of how many goals should be scored, given the quantity and quality of shots taken. It works for offense and defense, as a shot that is worth 0.25 goals for when one team takes it is also worth 0.25 goals against on the opposing team.
Expected goals tell us how well a team has played. If a team has a higher expected goal total than its opponent, it can be said that they have outplayed their opponent.
A Minor Adjustment to Expected Goals
The relationship between expected goals and goals isn’t perfect. Since 2011-12, the total expected goals of all teams is 73281.95, while the actual goals scored is 75447. For every 1.00 expected goal there is 1.0295 actual goals.
For this article I will multiply each team’s expected goals (for and against) by 1.0295. This will produce a balance when comparing goals to expected goals: there will be about as many teams exceeding their expected goals as there are teams falling short of their expected goals.
For example, the 2021-22 Carolina Hurricanes had official expected goal totals of 284.06 (xGF) and 228.27 (xGA): that was modified to 292.44 and 235.00. I will refer to the adjusted totals as axGF and axGA, where the “a” stands for “adjusted.”
After having done this, the eleven season total of axGF is 75443.77, just three-ish goals shy of the 75447 actual goals.
Parsing the Statement: “They Still Rank Well”
The following chart shows the adjusted expected goals per game played (axGF/GP) of all teams in the NHL this season, as of January 25th, 2025.
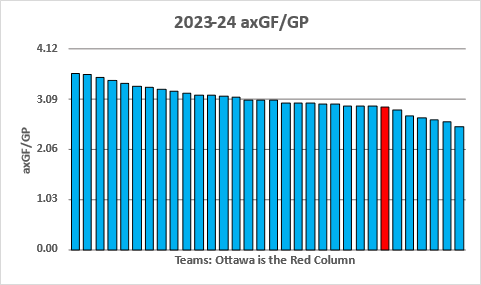
You may have noticed the axGF/GP Axis has unusual units (1.03, 2.06, 3.09, 4.12). I did that on purpose so that one of the crossing grid lines shows the league average (3.09).
Clearly, the Senators do not rank well at adjusted expected goals for. They are 26th in a 32-team league; they are below the league average.
Now I’m going to focus on the word “still” in Coach Green’s quote. He said still ranked well in expected goals, which implies that they had ranked well earlier in the season. So, did they rank well earlier in this season?
On December 1st, 2024, Ottawa’s axGF/GP was 3.00, practically the same as it was six weeks later when this article’s data was copied. Six weeks later Ottawa’s axGF/GP had dropped ever so slightly to 2.94. Their rank in axGF/GP was 20th at the start of December, which dropped to 26th recently. To be fair to the Senators there were twelve teams between 3.15 and 2.85 in December, and twelve teams between 3.08 and .78 recently. These teams are about as close as the middle-of-the-pack skiers in a major bobsled event, where the difference between 10th and 20th is a couple of tenths of a second.
The Senators are not “still” ranking well at xGF/GP because they haven’t ranked well at axGF/GP for the entire season.
Parsing the Statement: We’ve Been Pretty Good Offensively
There is another statistic the NHL has that I rarely look at: high-danger chances. I’d love to tell you want a high-danger scoring chance is, but I don’t know the details well enough. Being close to the net makes it more likely that a shot is a high-danger chance, and rebound shots and rush shots are more likely to be a high-danger chance.
High-danger scoring chances are converted to goals about 12.5% of the time, while other shots are converted to goals about 9.25% of the time. While they are more dangerous, I disagree with them being called “high danger” if they only increase scoring by 3.25%.
Another sign that they are generous with how some shots are designated as “high danger” is the number there are in a game: the average for a team is a little over 11 per game in 2024-25, meaning that there are almost 23 high danger scoring chances in the average game. I don’t think I have witnessed a game this year where I thought there were even ten high-danger scoring chances.
It’s time to return to parsing Coach Green’s statement instead of taking guesses about which shots are deemed to be highly dangerous.
It is reasonable to say that a team that is good offensively gets a good number of high-danger chances. How has Ottawa done at high danger chances? Over the three previous seasons, Ottawa averaged 12.5 high-danger chances per game and scored 1.57 goals per game from those chances, a little over the league average. In 2023-24 they averaged 10.41 high-danger chances per game (24th in the league), producing 1.22 goals per game (27th).
The Senators have not been pretty good offensively; they are below league average.
Parsing the Statement: The Puck Just Isn’t Going in the Net
I like to refer to the difference between goals for and expected goals for as Finishing. At the individual player level, it measures a player’s scoring touch. At the team level, it shows whether a team has more players with good scoring touch than bad scoring touch.
For this article, I will focus on team metrics.
After their 48th game played this season, the Senators had scored 131 goals and had 140.92 adjusted expected goals. They were on pace to score about 17 fewer goals (16.94) than expected for the season, putting them 22nd in the league.
For comparison the league-leading in Finishing at the time the data were copied were the Tampa Bay Lightning. They had 149.23 adjusted expected goals and 170 goals (on pace to score about 36 more goals than expected).
Finally, the data agree with Coach Green: the puck isn’t going into the net for the Senators. Strangely enough, the Senators are doing better at Finishing this season than they have since 2021-22.
Summary
Nobody would like to have their statement parsed six ways from Sunday, especially a statement given in an interview where time is an issue. When you get a chance to interview the coach of a team, you’ll only get a few minutes. The interviewer appreciates brevity in any response to any question, as it becomes possible to ask more questions.
It also isn’t fair that I have spent hours researching the data associated with the response. Coach Green didn’t have hours to craft his response.
But, if the coach is going to refer to data, you’d hope he’d be familiar with the data, that he understood the data. Coach Green’s statements are largely contradicted by the data. Ottawa is not well-ranked in expected goals, and they haven’t been pretty good offensively. The puck hasn’t been going in the net, but that is nothing new for the Senators.
If this statement accurately reflects Green’s opinions on the subject, then the Senators are in trouble as a team. One of the things a coach should do is help his team improve, and Ottawa’s offense is an area that needs improvement. If the coach thinks the team is doing fine offensively, why would he change anything?
I think a better response would have been “There has been a lot of talk about offence around our team for a bit now and we know we need to generate more offense and be more efficient in the offense we generate.” Had he said this, I’d be happy that Senator management knew they have a problem that needed to be addressed.
Etymology
While the phrase “six ways from Sunday” has several meanings, the way I used it in the summary is based on its meaning “in every way possible.” The phrase seems to have originated in the middle eighteenth century.
Related Articles