
As there were two articles for powerplays (Powerplay Teams, Powerplay Players), so there are two for penalty killing: one for teams and one for players. Penalty killing is a team activity performed by players, and there are statistics for teams and players. Teams will be ranked based on their goals against per 60 minutes while players will be ranked using a rating system.
Penalty Kill Teams is the companion article to this one. In it you will find how teams ranked over the last three seasons. The 2021-22 Carolina penalty kill will be featured.
Penalty Kill Index (KX)
Any of the statistics or indexes created at Stapled To The Bench involve a consideration of the supporting data: how much is enough?
I would prefer to use only one season of data to rate a player as a penalty killer in a season, but most penalty killers do not play enough in one season to make for a reliable measurement. Using the same time qualifier as for power play players (45 seconds per scheduled game), the average qualifying penalty killer has 25 minutes less ice time than the average qualifying power play specialist.
For Penalty Kill Index (KX), I have set the qualification standard for a player at 45 seconds per scheduled game over two consecutive seasons, with the added proviso that the player must qualify in both seasons. To qualify for 2021-22 KX, a player will have to have played at least 42 short-handed minutes in 2020-21 and 61.5 short-handed minutes in 2021-22.
KX Statistics
As with PX, the statistics used for KX will be a mix of team statistics which are generated while a player is on the ice and individual statistics generated by the player himself.
The individual statistics that will be used are hits, blocked shots and takeaways. The team statistics will be Corsi (shot attempts), shots, high danger chances, expected goals and goals. The team statistics are all “against”: Corsi against will be used rather than net Corsi, for example. All statistics will be converted to ‘per 60 minutes’, so that players who play different amounts of time can be evaluated with the same measure.
KX Calculations
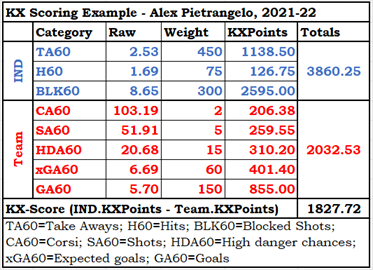
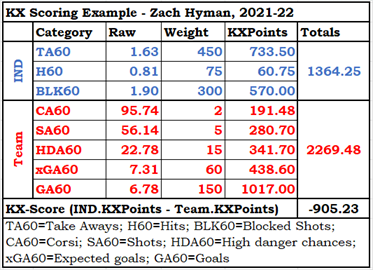
Each of the KX statistics is multiplied by a weight assigned by yours truly. Individual and Team statistics are totaled, and then the Team total for a player is subtracted from his Individual total to get his final KX-Score.
The weights were assigned with two goals in mind. First, each of the statistics should contribute appropriately to KX-Score: Shots Against should have a smaller impact on KX-Score than Goals Against. Second, I wanted the top players to have positive KX-Scores but didn’t mind if most players were negative. KX-Score is an arbitrary number whose only purpose is to put the penalty killers in order.
233 players qualified for KX evaluation for the 2021-22 season, and detailed information for two randomly selected players is shown below. Alex Pietrangelo was 11th in KX while Zack Hyman was among the lowest-rated (216th).
Top Penalty Killers – 2021-22
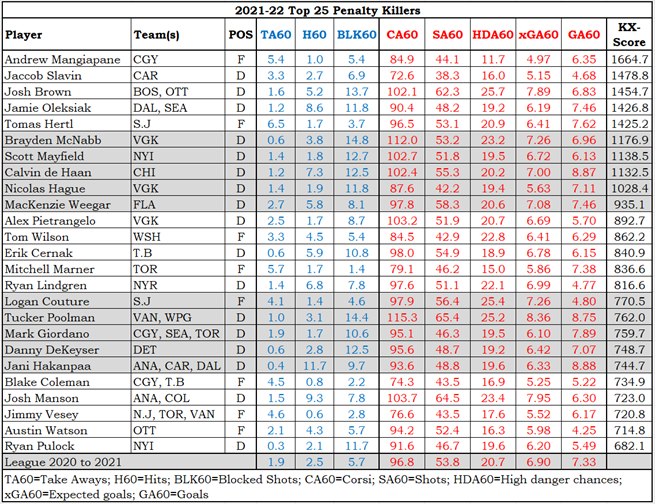
I apologize for the wall of numbers in the Top 25 Penalty Killers table. I wanted to show all of their contributing statistics.
Tucker Poolman, who is 17th in KX at 770.5, is not exactly a shining moment for the KX system. He is above average in all of the Team statistics (it is bad to give up an above average number of shots or goals). He is below average in takeaways and slightly above average in hits. He is extremely above average in blocked shots, and that one statistic places him in the top 25. Of all the players who qualified, he has played the least time shorthanded.
Persistence, Lack Thereof
I also calculated KX for the 2020-21 season, which obviously uses data from a season that was used for 2021-22. You’d think that would lead to a lot of repetition at the top of the standings, but none of the top 25 in 2021-22 were in the top 25 the season before.
One reason for this is that the strength of a team’s penalty kill changes from season to season, sometimes significantly, which obviously impacts the player statistics.
Summary
In the part of the article where examples of the calculations for two players are provided, I was careful to say that Zack Hyman was “among the lowest-rated” instead of saying he was “one of the worst penalty killers.” There are at least 700 players in the league who are worse at penalty killing than Zack Hyman, and none of them got much time on the penalty kill. Jesper Kotkaniemi played 2.63 minutes shorthanded in the last two seasons, Alex Ovechkin played 2.75 minutes shorthanded, Hyman played 221.2 minutes shorthanded.
The KX formula is adequate when it comes to identifying better penalty killers. Merely adequate, far from perfect. If your opinion was that some guy in the second 25 (let’s say Sebastian Aho of Carolina or Brandon Carlo of Boston) is actually one of the best penalty killers in the league, I would not put up a big argument.
On the other hand, if you were to tell me that Zack Hyman was one of the best penalty killers in the league, I would avoid a big argument by not saying anything at all: I do not like to argue with crazy people. Hyman is a better penalty killer than Ovechkin, but he’s nowhere near as good as Tomas Hertl or Logan Couture.
Another strike against the KX system is the lack of repetition at the top of the rankings from season to season. There is year-to-year repetition among the top scores, among the top hitters, among the top shot-blockers. Having zero repetition in the top 25 indicates that either the data is inadequate to measure PK, or the KX-System is a poor measure.
It is my sense that penalty-killing is a skill that some players have. It is my sense that the better players should repeat from season to season. While I am quite happy with some of the indexes that have been created by Stapled To The Bench (Productivity Rating, Value Rating, Center Rating, Powerplay Index, Disruption Index) I am not happy with the Penalty Kill Index. I will only do player-level penalty killing evaluation in the future if I find a methodology that makes more sense.