
As there were two articles for powerplays (Powerplay Teams, Powerplay Players), so there are two for penalty killing: one for teams and one for players. Penalty killing is a team activity performed by players, and there are statistics for teams and players. And once more, two articles share the same first paragraph. Teams will be ranked based on their goals against per 60 minutes while players will be ranked using a rating system.
Penalty Kill Players is the companion article to this one. In it you will find a description of the Penalty Kill Index (KX) used to rank the players.
Penalty Kill Goals Against Per 60 Minutes
I will rate team penalty killing using time-based data (PKGA60 – Penalty Kill Goals Against per 60 minutes of shorthanded play) instead of frequency data (PKP – Penalty Kill Percentage). Most fans are aware of penalty-kill percentage and completely unaware of PKGA60, so I need to show that the two statistics are similar in order to use PKGA60. The following chart shows how the two statistics compare, based on data from February 7, 2023.
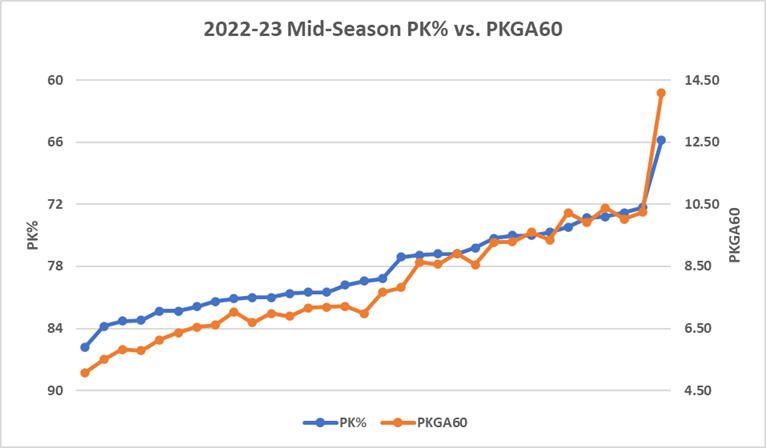
Penalty Kill Percentage (PK%) is the blue line and its scale is on the left. Please note that the PKP scale is reversed, with the higher value at the bottom: the lower a team is on the chart, the better its PK%. PKGA60 is the orange line using the scale on the right. Again, the lower a team is on the chart, the better its penalty kill is.
Paraphrasing John Maynard Keynes (1883-1946), the founder of modern theoretical macroeconomics, the two lines are “all sorts of the same thing.” [Editor’s note: it is highly unlikely JMK said anything like that.] The two lines are as close as two peas in a pod.
The team on the right-hand edge of the chart is Vancouver. The Canucks are struggling on the penalty kill this season.
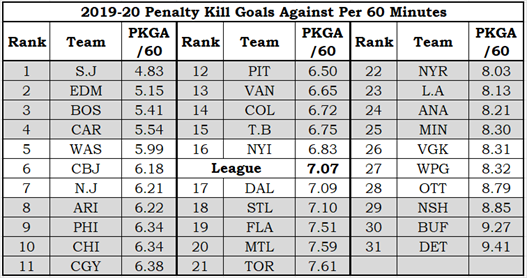
2019-20 Penalty Kill Teams
Three seasons ago is a long time in terms of penalty kill units. Typically, less than half of the players who qualify as a penalty killer in one season will also qualify three seasons later. Consistency of performance is, as you will see, an issue when it comes to penalty killing.
The table has three sets of three columns, which produces a flatter but wider table. The leftmost column shows a team’s rank (19), the middle column shows its abbreviated identifier (FLA = Florida) and the rightmost column shows that team’s PKGA60 (7.51).
San Jose’s penalty kill was the best in 2019-20. A quick check on a website (espn.com/nhl/standings) shows that the Sharks led the league in PK% (percentage of penalties killed) at 85.7% that season, and that Detroit trailed the league at 74.3%.
2020-21 Penalty Kill Teams
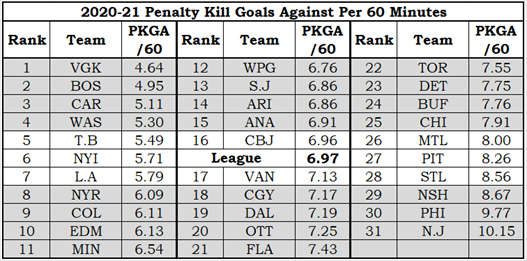
There is some consistency among the teams from season to season at the top and bottom of the standings. Boston, Carolina and Washington were in the top five both seasons. Nashville was in the bottom five both seasons.
The main story with penalty killing is inconsistency.
San Jose went from 1st to 13th, Edmonton went from 2nd to 10th, Philadelphia went 9th to 30th and New Jersey went 7th to 31st. An improvement that absolutely nobody saw coming was Las Vegas going from 26th to 1st.
These results don’t make a lot of sense. A team’s penalty kill unit always changes from season to season: old players leave, new players arrive, penalty-kill duties can be re-assigned and special team coaching duties can be re-assigned. But how does a team go from 6.2 goals against per 60 minutes to 10.2? How does a team go from 8.3 to 4.6? Those are massive changes that should not happen when your league has the best players in the world.
The reason team penalty-kill statistics bounce around from season to season is: time. In 2020-21, most teams were shorthanded for the equivalent of four to five games (240 to 300 minutes). The best team in the league will probably go 0-4-1 in five games; the worst team easily go 4-1-0 in five games. In such a small timeframe, good saves and bad bounces can have an incredibly huge impact on statistics like PKGA60.
Vegas was among the teams with the least amount of time played shorthanded. Had a mere handful (five) more goals been scored against Vegas they would have been sixth instead of first. Five goals in 2020-21 is the equivalent of one goal every eleven games played: it does not sound like much, but it certainly has an impact.
2021-22 Penalty Kill Teams
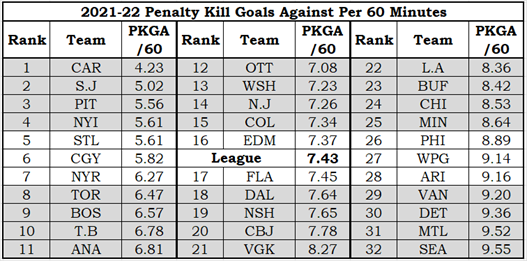
Inconsistency from season to season continues to be the constant of penalty killing. San Jose went back in the top five, Vegas went from 1st to 21st, Pittsburgh went from 27th to 3rd. The league average PKGA60 (7.43) was the highest of any season since 2007-08.
2021-22 Carolina Hurricanes
With the increase in powerplay scoring in 2021-22 to the highest level since 2007-08, Carolina’s penalty killing must be recognized. The Hurricane penalty kill in 2020-21 was great: 3rd in the league and 1.86 goals per 60 minutes below league average. In 2021-22 they were excellent, 1st in the league and 3.20 goals per 60 minutes below league average.
In 482 shorthanded minutes, Carolina gave up only 34 goals. Carolina played the most shorthanded minutes in the NHL, largely because they didn’t give up goals and had to play the entire penalty shorthanded. By way of comparison, the New York Islanders also gave up 34 shorthanded goals, but they were shorthanded for only 364 minutes.
To whom should the credit go for the Hurricane’s performance: the goalies or the skaters? A closer look at penalty kill data indicates that while the goalies played better than league average, the skaters deserve the bulk of the credit. See if you agree with my logic.
Given how long Carolina was shorthanded, they should have given up 59 goals. ABased on Corsi, shots, high danger chances and expected goals, Carolina should have given up 39 to 42 goals. The Hurricane penalty kill unit reduced opponents’ scoring chances, and thereby reduced their goals against by 17 to 20. Carolina actually gave up 25 fewer goals than expected, so the goalies have to be credited with the remaining reduction in goals against (5 to 8 fewer goals against). Carolina’s penalty kill skaters should receive 75% of the credit for their incredible season.
2022-23 Penalty Kill Teams – Mid-Season(ish) Standings
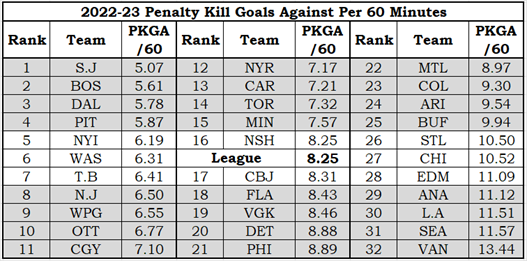
San Jose, Pittsburgh and the Islanders have stayed in the top five, but Carolina has dropped to 13th and St. Louis to 26th.
While there was an increase in powerplay scoring in 2021-22, in 2022-2023 there is an INCREASE. One of two things has happened: power plays are more effective or penalty killing is less effective. Logically, it is obvious that the increase in power play scoring is related to how teams with the power play are performing. (If a change in penalty killing tactics resulted in more goals being given up, any team would revert to their previous tactics, and they would do so pretty darn quickly.)
The seven teams with the highest PKGA60 in 2022-23 (St. Louis to Vancouver) are also the seven teams with the highest PKGA60 since 2007-08. Power play scoring is way up, so penalty kill efficiency is way down.
Summary
It is perfectly reasonable to rank teams on their penalty killing prowess by using PKGA60. Had I used penalty kill percentage the seasonal ranking order would be almost identical.
The biggest disappointment is that individual team’s rankings can change wickedly from season to season, with variations much higher than could be expected from changes in personnel and coaches. It produces the impression that there is a large amount of luck in killing penalties, and I think that is the correct impression.