
Phil Kessel (cue the A&W Bear theme song, a tuba driven jingle called “Ba-Dum Ba-Dum”) has just broken the consecutive games played record, and that brought to mind some statistics about him I noticed a while ago: hits delivered and hits taken.
Longevity Through Passivity
When you picture an Iron Man, the image of Phil Kessel does not spring forth. You probably think of a lean, muscular, fast-moving player. Kessel has none of those traits. He is the A&W Bear: chubby, pudgy, and he’d have trouble keeping up with the guys and gals who scrape the ice mid-period.
So how does such a player avoid injury? Luck is one key factor. So many players get injured in the warm-ups when an errant puck strikes them in the head, or when an errant teammate steamrolls him, or during a game when a skate gets stuck in a rut in the ice, or an errant teammate steamrolls him, or when he blocks a shot with a non-expendable body part. Phil has avoided all of those situations, and many more.
Another source of injuries is the constant barrage of inelastic collisions that a player is subjected to in the course of a game. On watching him play, Kessel seems quite adept at avoiding those collisions, either as the aggressor or the recipient.
Hits Delivered, Hits Taken
Amongst the statistics that NaturalStatTrick.com provides are hits and hits-taken. I went back six years and got those statistics for all players.
Phil Kessel is credited with 454 games played and 8,002 minutes of ice-time. I think the site did not count one game that Kessel played last season near the birth of his child. He was on the ice for the opening faceoff and registered one shot. He was rushed off the ice, out of the arena, shipped to the airport and private-jetted back to Arizona. I guess that’s another way to avoid getting injured.
Rather than compare Kessel to all 1,579 players who played at least one game in the last six years, I decided to compare him to all players who either played 400 games or who had 7,000 total minutes of ice-time. That is a group of 204 players, including Kessel.
For each player in the group, I calculated their hits and hits-taken per 1,000 minutes of ice time. I’ll use Boone Jenner as an example. Mr. Jenner played 404 games and, more importantly (for the calculations), was on the ice for 7,079 minutes. He delivered 844 hits and took 453 hits. Per 1,000 minutes, he delivered 119.2 hits and took 64.0 hits.
The averages for the group were 58.6 hits delivered and 63.3 hits taken per 1,000 minutes.
Kessel is a little below average in both categories: 6.7 hits delivered and 28.6 hits taken.
Visualizing Hit Data
Below is a scatter chart that shows the hits-taken and hits-delivered per 1,000 minutes of all 204 players. Hits-taken is the vertical axis, and all players were between 0 and 140 hits-taken per 1,000 minutes. Hits-delivered is the horizontal axis, where 203 players were between 0 and 215 hits per 1,000 minutes and Ryan Reaves (the lone dot on the right side of the chart) was at 378.8 hits-delivered per 1,000 minutes.
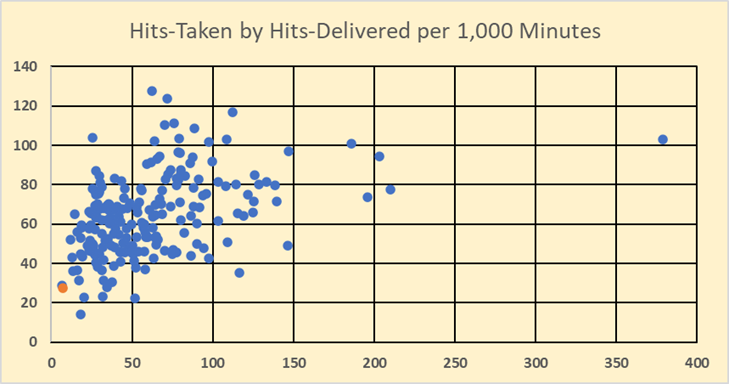
Phil Kessel is represented by the orange dot near the bottom left of the chart, very much the opposite of Ryan Reaves. Those of you who are sharp of eye will notice a blue dot under the orange dot, peaking out just above it. That is Johnny Hockey, also know as Johnny Gaudreau.
Gaudreau was even stingier at handing out hits than was Kessel: 6.7 to 7.4 hits per 1,000 minutes, respectively. It looks like Gaudreau is the stingiest hitter in the league, but he isn’t: that honour belongs to Kessel. The next section will explain why that can be stated.
Official Statisticians
When looking at judgement-based statistics (such as hits, blocked shots, Corsi) from all games, you have to be aware that half of a player’s games were played in front of one statistician. Statisticians work for the league (not the home team) and live in the home-team area. One person or group will work all of the home games for a team.
In my article Correcting Hit Counts I showed that some team hit counts are much different at home compared to on the road. Calgary was one of those teams. At home they averaged 43.0 hits per game, on the road they averaged 52.5 hits per game.
Gaudreau’s data was impacted by the Calgary statistician(s): he played half of his games in front of people who significantly under-count hits.
To be fair to all 204 players, I re-did the hit calculations using just the data from their away games. Over a couple of hundred games in front of 30-plus sets of statisticians, a clearer picture of each player’s average hit data is provided.
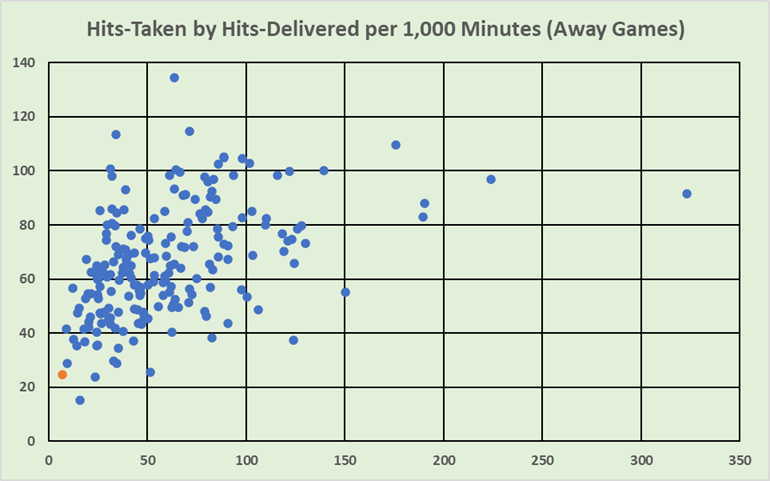
Phil has delivered the least hits per 1,000 minutes in road games: 204th of 204 players. In terms of hits received, he’s 202nd. He doesn’t dish them out, and he doesn’t get dished.
Above and to the right of Kessel’s orange dot is Gaudreau, ranking 202nd and 199th in the two categories. The dot below and to the right of Kessel belongs to Keith Yandle, who’s massive consecutive game streak was stopped by decision of his team’s management. Yandle was the least frequently hit player per 1,000 minutes over the last six years, a neat achievement for a defenseman. Most of the low-hit players were forwards, but three defensemen made the top ten: Duncan Keith, Shea Theodore and Keith Yandle.
That lone dot out to the right? Yeah, that’s Ryan Reaves.
I’ll drop one final chart on you, using the same scale for both the vertical and horizontal axes (the plural of axis is axes!).
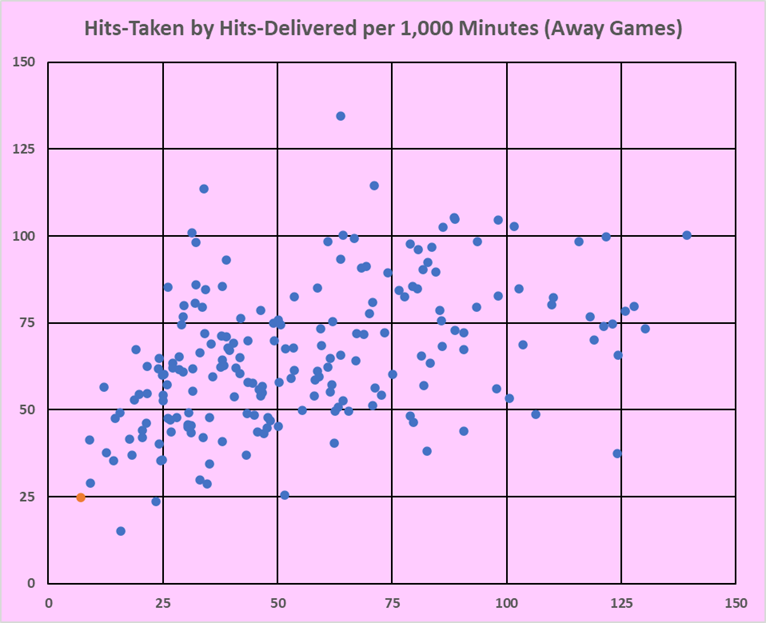
I dislike publishing charts that are missing data, but I also dislike publishing charts where scales which should be the same are not the same. The other charts show all of the data but use different axis scales. This chart shows almost all of the data and uses the same axis scales.
The chart above provides a better focus on Phil Kessel, while the other charts draw your attention to Ryan Reaves and Marcus Foligno and Milan Lucic. I prefer the chart that focuses on the subject of the article.
Summary
Kessel’s longevity cannot solely be credited to his lack of hitting: you don’t play more than 900 games without having a good level of skill for a long time. Last season he still rated as a PR-Regular, and he also was a VR-Regular (VR is Value Rating, which evaluates a player based on his last three seasons).
The four horsemen of Kessel’s Iron Man streak: a very good level of skill, not hitting players, not getting hit and pure luck: the four horsemen of Kessel’s Iron Man streak.
Trivia: Kessel is 202nd in terms of shots blocked per 1,000 minutes. There are four players in the 204 who blocked ten times as many shots.