
This is one of three articles investigating player skill sets using expected goal data. I hope to identify the best shooters (Finishing), the best offensive players (Creating), and the best defensive players (Preventing).
This article focuses on Creating.
Measuring “Creating”
How can we measure hockey players for their creativity using expected goal data? My first thought was that an offensive player’s team would have a higher xGF60 (expected goals per 60 minutes at 5v5 play) when the player was on the ice. I looked at last season’s data and found the twelve players with the highest team values for xGF60.
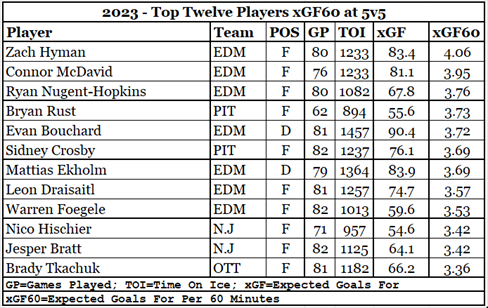
And so we see the problem: hockey is a team sport and, when using 5v5 data, each team has five players on the ice who all get the same team-level expected goal data. The data of average or poor offensive players is affected by their linemates. Consider Warren Foegele (EDM). His career average points per 82 games played (Pts82) is 31, while Leon Draisaitl’s Pts82 is 98. Warren Foegele is not an offensive threat, but he got a lot of ice-time with offensive threats in 2023-24.
If I were to use team-relative xGF60 (TRxGF60) for players, where a player’s xGF60 is compared to his team’s xGF60, a different problem would emerge. Good offensive players who play on bad offensive teams would occupy many of the top spots, while good offensive players on good offensive teams would drop down the rankings.
Creating – Adjusting the Measurements
One of the problems with using xGF to measure a player’s offensive creativity is the time frame, as one season is simply too short a reference period to measure Creativity with accuracy. In one season, a player could have a fortunate situation where he plays with offensive linemates. But, over three seasons, a player will almost certainly play with different linemates, and will sometimes even play on different teams. The longer time period gives us player-level data with a wider spectrum of linemates, providing a better estimate of what the player does compared to what his linemates do.
From NaturalStatTrick.com I got even-strength on-ice data for players for the last three seasons (2021-22 to 2023-24). To qualify for this evaluation, players had to play at least half of the games in each of those three seasons. This produced a set of 415 players, ranging from Connor McDavid (EDM) to MacKenzie Entwistle (CHI). The top twelve at xGF60 are shown below.
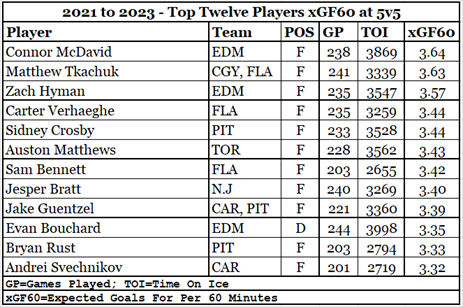
While this is far from perfect, it is close to acceptable. The list has eleven offensive players and a frequent linemate of Sidney Crosby (Bryan Rust). Is there data that indicates that Bryan Rust is on this list because he plays with Sidney Crosby rather than because he’s an offensive threat? Wowie, that’s a good question, and WOWY is the data that applies to this situation?
Creating – Using WOWY Data
WOWY stands for “with or without you”. It shows on-ice statistics for two players in four states: when each is on the ice together, when each one is on the ice without the other, and when both players are on the bench. I’ll start by showing the WOWY data of Connor McDavid and Zach Hyman, at 5v5 play, from 2021-22 to 2023-24.
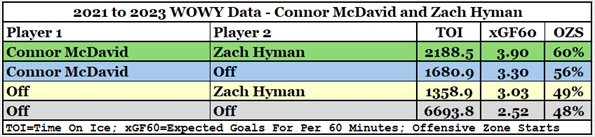
This small table packs a lot of information.
The xGF60 column shows us that each player, by himself (rows 2 and 3), is more offensive than their teammates (row 4). It also shows that McDavid and Hyman together (row 1) are a great combination: together they generate much more offense than when either is on the ice without the other.
The OZS column figure is offensive zone faceoffs divided into the total of offensive and defensive zone faceoffs (ignoring neutral zone faceoffs). A figure over 50% means a player was involved in more offensive zone faceoffs than defensive zone faceoffs. Hyman by himself does not get a lot of offensive zone faceoffs (49% to the team’s 48%), but in combination with McDavid gets a lot of offensive zone faceoffs (60%).
Both players generate more offense than their team does, and in combination, they generate way more offense. They form a very effective pair. Now let’s look at Rust and Crosby.
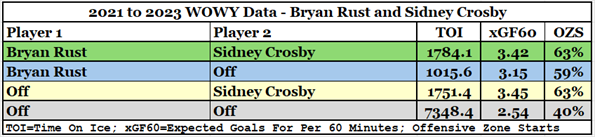
Both players are heavily used in offensive zone faceoffs, and both players generate more offense (3.15 and 3.45 xGF60) than the team generates with them on the bench (2.54). In combination, their offense is just a little below what Crosby does by himself. They are not nearly as effective a pair as McDavid and Hyman.
It may have been a bit harsh to refer to Bryan Rust as “a linemate of Sidney Crosby”, as his WOWY data shows that he generates more offense (3.15 xGF60) when on the ice with Crosby on the bench than Pittsburgh generates (2.54 xGF60) when both are on the bench.
Rust’s three most frequent linemates are Crosby, Jake Guentzel, and Evgeni Malkin, none of whom are defensive studs, all of whom drive up Rust’s xGF60. When Rust is on the ice without any of those three guys, his xGF60 is below the team’s xGF60.
Rust benefits from being paired with offensive linemates. A better description of him would have been “a frequent linemate of Crosby, Guentzel, and/or Malkin.”
Summary
Expected goals do an adequate job of identifying players who generate offense, although the final method used favours players who play on offense-minded teams and with offensively talented linemates.
Using data from three seasons is an adequate way to determine which players drive offense, keeping in mind that the results are influenced by linemates and team play. Just outside the top twelve are Aleksander Barkov (FLA), Sebastien Aho (CAR), Brady Tkachuk (OTT), William Nylander (TOR), Nikolaj Ehlers (WPG) and Leon Draisaitl (EDM).
Bryan Rust (PIT) is the exception that proves the rule. It looks like he made that top-twelve list because of his frequent linemates (Crosby, Guentzel, Malkin) rather than because of his contributions.
Players cannot generate offense independent of their teammates. Connor McDavid has had more offensive success when paired with Zack Hyman than when he was paired with Zack Kasian. On the other hand, Kasian had better offensive success when paired with Connor McDavid than when he was on the ice without McDavid.
The best measure of a player’s creativity is his xGF60 data over three seasons, provided he has played at least half of the games in each of the three seasons. And even with that amount of data, a player’s statistics are influenced by his team, his linemates, and his opportunities.
Related Articles
Players and Expected Goals – Finishing