
As I continue to play with Expected Goal (xG) data, I now turn to the player level. There are three aspects of player talent that I would like to investigate using xG: finishing, creating, and preventing.
Finishing measures a player’s scoring touch, looking at how many goals he scored compared to his individual expected goals.
Creating measures a player’s offensive influence on team play, telling us how much his team should score when he is on the ice.
Preventing measures a player’s defensive influence on team play.
This article will focus on Finishing. Companion articles will look at Creating and Preventing.
Finishing and Goals
The Finishing statistic (iF) compares how much a player scores compared to how much he was expected to score, based on the quantity and quality of shots he took. The formula for Finishing is Goals minus Individual Expected Goals (iF = G – ixG), and data from all game situations (even strength, power play, penalty kill) is used.
Let’s start with the top goal scorers since 2007-08.
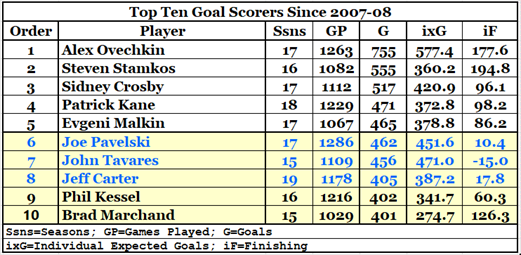
Our first lesson learned: not all great goal scorers are great shooters. In 6th, 7th, and 8th place are players who score because they are great at getting into scoring situations. They have scored about as much as an average NHL player would have scored in those situations.
Stamkos, on the other hand, scores so much because of his finishing touch. His shots were worth 110 fewer goals than those of Tavares, yet he has scored 100 more goals than Tavares. The dude can shoot.
Finishing – Career Totals
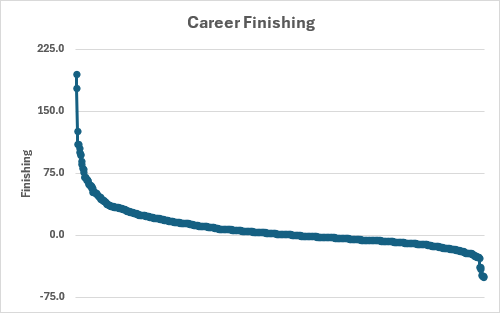
The following chart shows the distribution of Finishing for 709 players who have played at least 410 games (the equivalent of five 82-game seasons) since 2007-08. The three dots that stand out at the top-left of the line represent Steven Stamkos, Alex Ovechkin and Brad Marchand.
Let’s name some more names. Here are the top ten players at Finishing (iF) since 2007-08.
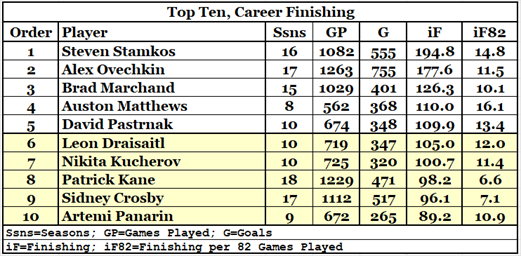
Players in this table are sorted by Finishing (iF). Also displayed in the table is their individual Finishing rate (iF82), which shows what a player’s iF would be over 82 games. The next table shows the players with the highest career Finishing rate.
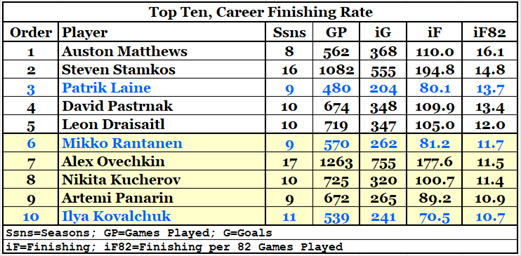
Rows with blue font (3, 6, and 10) did not make the top ten in Career Finishing. They lack games played rather than a finishing touch. Unfortunately for Kovalchuk, he lacked games played in the rich-statistics era of hockey (2007-08 to present). Now, let’s check out the top ten in finishing rate from 2023-24.
Finishing – 2023-24 Season
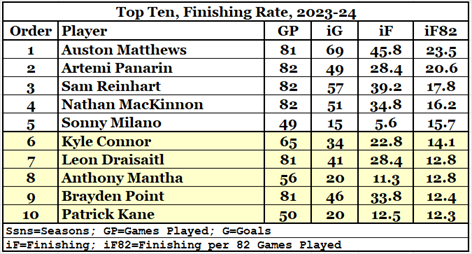
It is always important to have a time or games-played criterion when looking at rate data for a season: you want to avoid the one-game wonders. To qualify for the table above, a player had to have played at least 41 games. Even with that non-trivial criterion, the list has a couple of unexpected entries: Sonny Milano and Anthony Mantha. They didn’t shoot with great frequency, but they had great success when they shot.
The one-game wonder, by the way, is Luca Del Bel Belluz, whose iF82 was 71.3. He played one game in 2023-24, had 9½ minutes of ice time, got off two shots, and scored one goal.
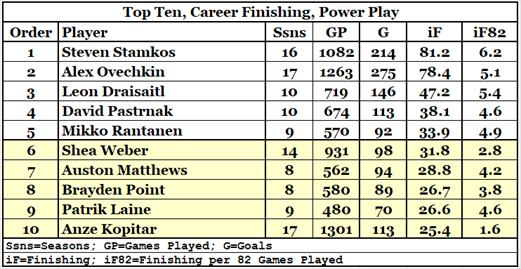
Finishing – Power Plays
There cannot be many surprises on the list (below) of players who have been the most successful at finishing while on the power play. The top three all have “offices” on the ice, positions from which they are very successful when they shoot.
Shea Weber might be a bit of a surprise. He was one heck of a good power-play specialist in his prime. He has scored more power-play goals than Auston Matthews or Brayden Point (he also has played way more games than either of them).
We might as well look at the career Finishing Rate for Power Plays.
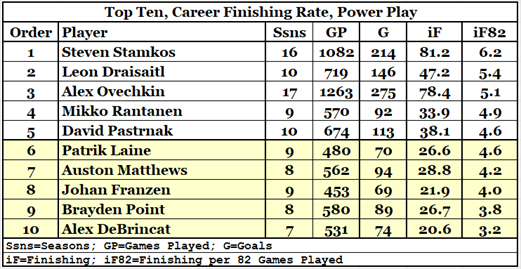
Three players were in the top ten of Career Finishing Rate but are not in the top twenty at Powerplay Finishing: Panarin, Kovalchuk and Marchand.
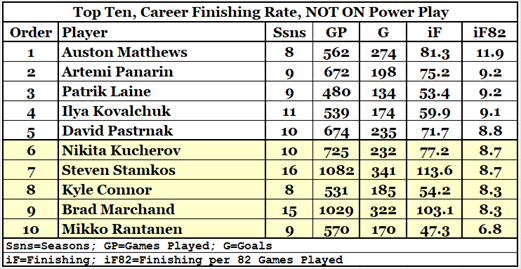
Finishing Rate – Even Strength
The data used for the calculations for the next chart came from subtracting powerplay statistics from all situation statistics. Logically, it covers both even strength and shorthanded play. I’ll stick with the “Even Strength” in this section’s title because players generate very few scoring chances when playing shorthanded.
There are two times that it hurts to write something in an article: it happens when I have to write something bad about an Ottawa Senator player or when I have to write something good about a Toronto Maple Leaf player. I’ve got two painful areas in this article, with the next paragraph being the first one.
Auston Matthews is an absolute beast at Finishing at even strength. His iF82 is 2.7 higher than Artemi Panarin’s second-place value. He is the most dangerous shot in the league at even strength, and it isn’t a close race. He is the Usain Bolt of even-strength Finishing: players who are very good at Finishing (Panarin through Marchand) pale in comparison to Matthews.
Finishing – Lack Thereof
I will rarely write anything critical of a player not named Ryan Reaves. In this instance, I felt it warranted to look at the bottom of the list.
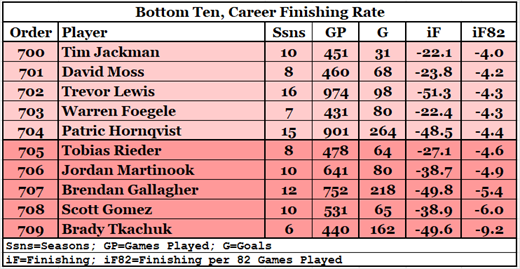
The bottom ten list is largely comprised of guys who score less than a dozen goals a season and have less than fifteen expected goals: they don’t get a lot of chances and don’t convert all of the chances they get. Hornqvist and Gallagher score 18 goals a season with 21 expected goals. Which leaves one player to discuss.
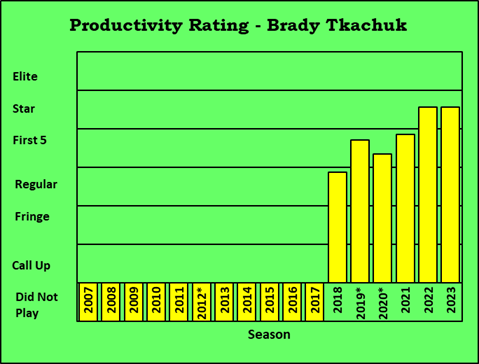
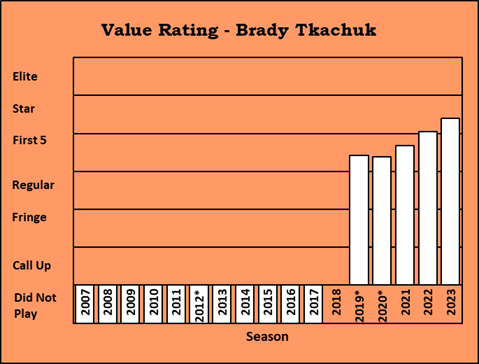
This is the second time in this article that I have to write something that pains me. The worst shooter in the league, by far, is Brady Tkachuk. Over his career, he has been a 25-goal man, but he could have been a 35-goal man if only he scored at his expected goal pace. His last two seasons have seen him in the middle of the PR-Star category. Had he scored nine more goals a season, he’d be on the edge of the PR-Elite and VR-Elite category.
Is Tkachuk’s low iF and iF82 caused by the nature of the shots he takes? Does the expected goal statistic overvalue his type of shots? I’d love to blame the statistics, but I can’t. He plays much like his brother Matthew Tkachuk, who has an iF82 of -0.9.
I would take Brady Tkachuk as a player on my team every day, “warts and all”. He is younger than, and better than, almost all of the forwards that scored about what he did last season (35-ish goals, 75-ish points). He is a top-fifty player in the league.
Being a fan of Ottawa means one has to deal with frustrations and having a VR-Star forward who doesn’t get a great return on his scoring opportunities isn’t the biggest frustration we have to deal with. Go Sens!
Summary
Not all players who score a lot of goals are exceptional at Finishing. The first table showed that Pavelski, Tavares, and Carter scored as frequently as expected based on the shots they took. Their exceptional skill is more about getting high-quality scoring chances than it is about having an excellent shooting touch.
Not every player who is exceptional at Finishing is high-scoring. Milano, Mantha, and Kane were in the top ten at Finishing Rate (iF82) in 2023, and all scored 20 or fewer goals. Of course, one of the reasons those players scored so little was that they missed about 30 games each last season. On the other hand, had they played every game they would have around 30 goals each: not a bad figure, but 47 players had at least 30 goals in 2023-24.
Most players who are good at Finishing overall are also good at Finishing on the Powerplay. The surprise is that there are a couple of players who were in the top ten overall but were outside the top twenty on the Powerplay.
Some players have hands of stone: they get good scoring chances but don’t convert on them as frequently as the average NHL player would.
To summarize my summary: Finishing statistics (iF and iF82) are excellent and accurate measurements of a player’s skill level when it comes to their shot-taking.
Related Articles
Players and Expected Goals – Creating
Players and Expected Goals – Preventing