
This is the third article investigating aspects of player abilities using Expected Goal data. The other articles focused on offense. The first article (Finishing) looked at a player’s scoring touch and the second article (Creating) looked at a player’s ability to generate offense.
In this article (Preventing) I want to focus on a player’s ability to reduce the scoring chances against his team. Prior to writing this article, I was doubtful that Preventing could be measured adequately with expected goal data.
Measuring “Preventing”
Given what was done for Creating, I’ll assume that defensive measures require three seasons of data for a more accurate assessment. Here are the twelve players with the lowest xGA60 (expected goals against per 60 minutes) over the last three seasons. As with Creating, players had to play at least half of the games in each of those three seasons to qualify for evaluation.
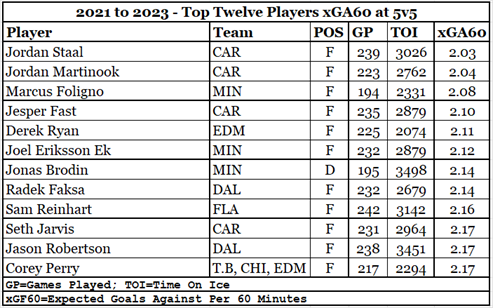
This list shows us players from defensive teams (Minnesota, Carolina), players who play against third- and fourth-line forwards (Corey Perry, Derek Ryan), and players who are heavily used in offensive situations (Robertson, Reinhart, and Perry). We should expect players who play against lesser opponents and/or who start most of their shifts in the offensive zone to have better-than-average xGA60 data.
The most egregious member of this top twelve is Corey Perry, a fourth-line forward who plays against fourth-line opponents and who gets a lot of offensive zone faceoffs. He gets offensive zone faceoffs because he is a defensive liability. He made this list as a result of where he starts and who he plays against.
Using team-relative xGA60 (TRxGA60) would produce a list of players who have good xGA60 data on teams that overall are less defensive in nature. Of the twelve players above, the two with the best TRxGA60 are Derek Ryan and Sam Reinhart. The players from Minnesota and Carolina would be penalized because their entire team plays defensively: that is very unfair to them.
In my opinion expected goals against data, by itself, cannot be used to identify the better defensive players. The best defensive players are placed in situations that naturally increase their xGA60 statistics: they are given lots of defensive zone starts and they constantly have to battle against the opponents’ best offensive players.
Measuring “Preventing” in a Dream World
What is needed to measure a player’s defensive contribution? Situational Expected Goals Against (sxGA), which would estimate what an average player’s expected goals against data should be, given where he started his shift (offensive zone, defensive zone, neutral zone, or on-the-fly line change). Ideally, it would also consider whom he was playing against, such as whether he was on the ice against Zack Hyman or against Zack Kasian.
Determining sxGA is a level of data manipulation that I don’t want to get into, for two reasons. I started Stapled To The Bench with the goal of using freely available season-level data while using Excel as my data manipulation software.
The data needed for sxGA, play-by-play and time-on-ice reports, is not freely available at the season level. They are freely available at the game level, but I’m not about to individually copy more than 10,000 reports (three seasons, 82 games per team, 32 teams, three reports per game) to get the necessary set of base data.
If I had the necessary data, there’d still be the problem of manipulating it using Excel. This is the biggest reason I avoid game-level data. At the season level, I know that Aleksander Barkov (FLA) had 256 minutes of power-play time (256:10, precisely). I don’t want to add up 82 games worth of data to get that information (naturalstattrick.com does an excellent job providing that information) and I certainly don’t want to go through the shift charts and the play-by-play charts (to identify when Florida had a man advantage and whether Barkov was on the ice when they did).
Summary
Expected goal data does not do a good job of identifying defensive players. Good defensive players get more defensive zone faceoffs and face the better offensive players from their opposition, both factors increasing their expected goals against.
Using expected goal data to measure a player’s offensive and defensive talents resulted in a win (Finishing), a tie (Creating), and a loss (Preventing).
Related Articles
Players and Expected Goals – Finishing