
My plan for the 2022-23 season is to recognize the ten best players of each calendar month in three different manpower situations: 5v5, 5v4, and 4v5. A fourth category, TOTAL, will simply be the sum of a player’s other three ratings.
This will be a vote-free process because we don’t do voting at Stapled To The Bench (STTB). We also ignore opinions, both of others and of ourselves.
We do things using a process we like to call “math.” We will be using expected goal data to identify the best players. As usual, the data source is NaturalStatTrick.com.
Using Expected Goal Data
Expected goal data tells us how well a player is playing, and how good he is at generating offensive chances and limiting his opponents’ offensive chances. Goal data, on the other hand, is subject to something the statisticians refer to as luck.
STTB is looking to recognize players who were extremely effective when on the ice, players who played well regardless they scored.
October 2023 – 5v5 All-Stars
I will use Tyler Seguin (DAL) and Taylor Hall (CHI) to explain the details of how the 5v5 All-Stars were identified, as their careers have been intertwined since their draft season.
First, let’s look at their raw 5v5 data.
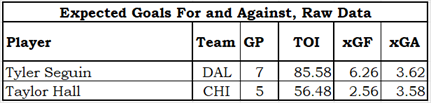
Based on their 2022-23 Value Ratings, Tyler and Taylor were quite similar to each other. Taylor had a better 2020-21, and Tyler has been better since. They are having quite different seasons from each other in 2023-24, as Tyler is playing on a team with Cup aspirations, while Taylor is playing on a team that is concerned about the future of Connor Bedard.
A player’s 5v5-Rating (R55) is calculated by subtracting his xGA from his xGF.
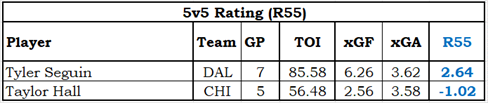
Tyler’s +2.64 puts him 22nd in the league, while Taylor’s -1.02 puts him 526th. The top ten players in terms of R55 for the month of October are shown below.
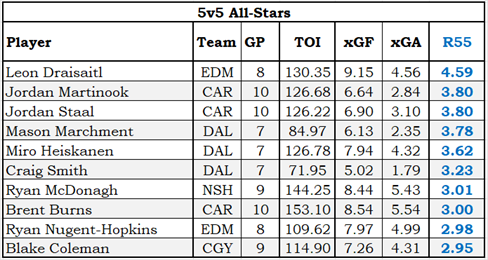
Due to the small number of games involved, the “clumping” of players from hot teams is expected. In October, the top ten 5v5 players had three from Dallas, three from Carolina, and two from Edmonton. The top three 5v5 teams are Edmonton, Dallas, and Pittsburgh. Between them, they have sixteen players in the top fifty.
The bottom three 5v5 teams are San Jose, Chicago, and Tampa Bay (!!), and they have twenty players among the fifty lowest-rated players. Steven Stamkos had a bad October at 5v5 play, ranking 670th out of 675 players.
An Aside – Offensive and Defensive Contributions
Expected goal data can also be used to determine if a player is more offensive or defensive in nature. This is done by comparing his xGF and xGA data to the league average xGF and xGA. This requires a return visit to Tyler and Taylor.
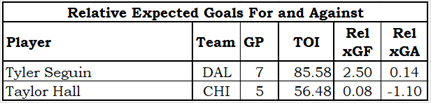
The league average expected goals data, calculated using team-level data at 5v5, is 0.044 goals per minute. In 85.58 minutes, the league average xGF and xGA would be 3.77. Tyler’s contribution is mostly offensive in nature, while Hall’s deficiencies are in the defensive department.
The top ten players in terms of 5v5 offense and defense are in the table below.
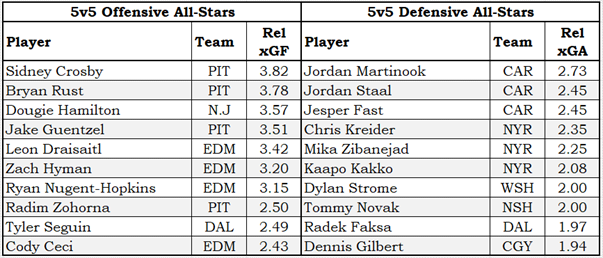
Did you notice that the xGF numbers are higher than the xGA numbers? It is much easier to play good offense than to play effective defense.
October 2023 – 5v4 All-Stars
Power-play and penalty-kill leaders will be selected based on their expected goals differential (expected goals for minus expected goals against) relative to the league.
Power-play leaders come from teams whose power-play is kicking ass: Washington, Pittsburgh and Tampa Bay. Each of these teams have an expected-goals-for-per-60-minutes over 12.00; no other team is over 10.00.
Did you notice that the xGF numbers are higher than the xGA numbers? It is much easier to play good offense than to play effective defense.
October 2023 – 5v4 All-Stars
Power-play and penalty-kill leaders will be selected based on their expected goals differential (expected goals for minus expected goals against) relative to the league.
Power-play leaders come from teams whose power-play is kicking ass: Washington, Pittsburgh and Tampa Bay. Each of these teams has an expected-goals-for-per-60-minutes over 12.00; no other team is over 10.00.
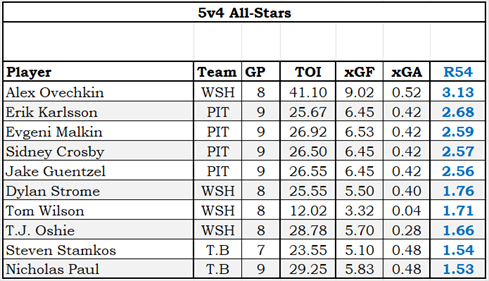
As a fan of the Senators, it is strange to see Nicholas Paul on a list of the top power-play specialists in the league. Firstly, he was Nick Paul in Ottawa: I’m not used to the more formal version of his name. Secondly, he was never a great power-play player in Ottawa.
The five lowest-ranked players in the league all come from the Chicago Blackhawks, which is strange only because the Blackhawk power-play ranks 25th in the league. Their second power-play unit is very weak.
The team with the worst power-play is the Dallas Stars, who have generated almost no offense with the man advantage. In 34.6 minutes of power-play, Dallas had 2.33 expected goals. In almost the same amount of power-play time (36.0 minutes), Pittsburgh’s power-play had more than three times as many expected goals (7.64).
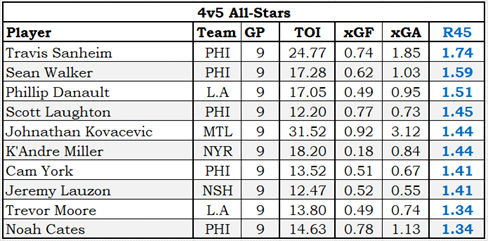
As a 4v5 penalty-kill can only have four players on the ice, the fact that five players from Philadelphia are in the top ten (with Sean Couturier in eleventh place) is amazing.
Four teams have given up more than 10.00 expected goals per 60 minutes of 4v5 play, with San Jose being the worst at 11.00.
If San Jose (worst PK) played 60 minutes shorthanded against Washington (best PP), the math indicates the final score would be 18-0. In truth, it would be much more of a blowout than that, as there would be no even-strength periods of play that would allow the Shark penalty-killers to catch their breath.
October 2023 – Comprehensive All-Stars
Who is contributing to their team in all of the three main manpower situations: 5v5, 5v4 and 4v5? I’d like the answer to be a simple addition of the three ratings used so far, but I need to make it more complicated than that.
I wanted the total ratings to favour players who played a lot in all three situations. A player got full credit for a particular rating if he was in the top 25% of players based on average situational time-on-ice per game played. Players who played less than that would receive a penalty based on how much time they missed. We need an example, don’t we?
Jake Guentzel (PIT) has excellent 5v5 and 5v4 data but had only 10 seconds of 4v5 time in October. That’s not 10 seconds per game, by the way, that’s 10 seconds total in his nine games played.
A player who didn’t play PP or PK time would technically have a 0.00 rating, which is unfair to players who played special teams. For example, the R54 average is -0.19, so a player whom the coach wouldn’t put on the ice for power-play rates higher than the average power-play player. His raw R45 for those 10 seconds is +0.02, while the time criteria for penalty kills is 120 seconds per game played and the penalty R45 rate is -2.00. For the purpose of calculating this comprehensive player rating, his R45 becomes -1.98. The same sorts of calculations are done for R55 and R54.
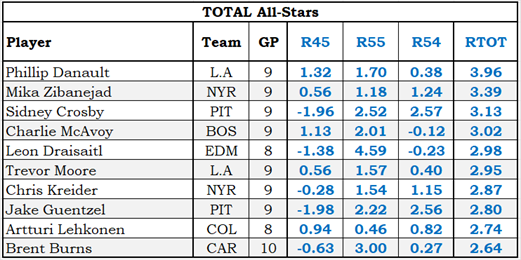
With that blather out of the way, here are the top ten comprehensive All-Stars for October.

Rather appropriately, Ryan Reaves ranks 666th among players with an RTOT of -5.74. Six of the bottom ten players come from San Jose.
October 2023 – Goalie All-Stars
Goalies will be evaluated based on the difference between their actual goals against and their expected goals against. It says here that if you give up fewer goals than expected, you are a good goalie.
In a small number of games, one game can have a significant impact on the standings. Joseph Woll’s (TOR) scary Halloween performance caused him to drop from first place to third place. Samsonov sat the game out and didn’t tarnish his 68th-place standing.
Summary
This was a fun article to write. It will be interesting to see how I handle November. I’m not sure yet what approach I’ll take, whether I’ll rate players based on their November play or based on their play through November (October would be included in the latter case).
I think the best list is the comprehensive list which uses RTOT. Future monthly awards might be shortened to just two tables: the comprehensive and goalie all-stars. Who knows what I’ll feel like as December approaches?
Related Articles
None yet. If I do this every month, those articles will relate to this one.