
Originally there was to be one article on powerplays, but after examining the data I determined that two articles were appropriate. Team powerplays are influenced by the players, and player statistics from powerplay time are influenced by the team. In a first for Stapled To The Bench, the first paragraph of two articles is identical.
The other article is Powerplay Teams. It evaluates teams in terms of their powerplay fortitude.
Players will be evaluated using a freshly created rating system called Powerplay Index (PX), which is based on their powerplay statistics. A formula will translate their powerplay statistics to a PX-Score, and PX-Score will put a player in a category (PX). The categories will use the same letters as grades from your school days: the best players will be in the PX-A+ category, the next best in PX-A, and so on down to the least effective players who get PX-F and may have to repeat their season.
I wondered whether the formula would identify players who were good on the powerplay but didn’t get many goals or assists. It did not do so. Powerplays are about scoring, and the players who score on a powerplay will get the higher ratings. The players who are key on the powerplay but don’t get many goals or assists are defensemen, who will probably get a lower rating than they truly deserve.
Powerplay Statistics
Powerplay Index (PX) is based on a combination of individual statistics and team statistics. A player’s team data comes from the time that a player was on the ice: the second powerplay unit will not get credit for the first unit’s accomplishments.
Powerplay skill is a quality, and so it is best to use descriptive statistics (team goals scored per 60 minutes) rather than specific statistics (team goals scored). Using descriptive statistics allows for the fair evaluation of players on teams that have different amounts of power play time, either because they missed games during the season or because they were on the second unit.
To avoid bestowing a high rating on a player who barely played there is a powerplay time requirement for players to qualify for categorization: 0.75 minutes of powerplay time per scheduled game. 2021 had the normal 82-game schedule, so the minimum time requirement for it was 61.5 minutes.
Powerplay Index Calculation Details
If you are not interested in the technical details, please skip to the next section.
Individual Accomplishments
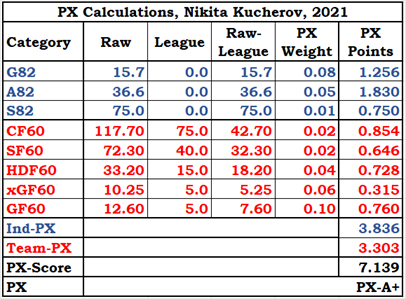
For each qualified player, three descriptive statistics were calculated: powerplay goals per 82 games, powerplay assists per 82 games and powerplay shots per 82 games. Nikita Kucherov played 47 games in 2021, and his powerplay statistics were 9 goals, 21 assists and 43 shots. Per 82 games, that works out to 15.7 goals, 36.6 assists and 75.0 shots.
Since these are descriptive statistics, fractions are perfectly acceptable.
Team Accomplishments
Team statistics are based on how the team did when a player was on the ice compared to 75% of the league average. Five team-level statistics were used: Corsi (shot attempts) for per 60 minutes, shots for per 60 minutes, high danger chances for per 60 minutes, expected goals for per 60 minutes and goals for per 60 minutes. 75% of the league averages were 70, 40, 15, 5 and 5, respectively.
Tampa Bay did quite well when Kucherov was on the ice. They had 117.7 Corsi for, 72.3 shots for, 33.2 high danger chances for, 10.25 expected goals for and 12.60 goals for.
All that is left to do is assign some weights and crunch the numbers.
Weighted Data
Each statistical category that is used to calculate a player’s powerplay-score (PX-Score) has an associated weight, as some categories (goals) are more important than others (shots).
The weights for each statistic used in the formula were determined without looking at individual player results, and the only adjustments made during the formula development process was to ensure that the total individual PX-Scores and the total team PX-Scores each contributed about 50% to the total PX-Score.
The blue text in the following table denotes individual data, while the red text denotes team data. At the bottom of it, you can see the individual total, team total, overall total and PP-Index, which is the player’s PX category. Team data is based on the league average, while individual data is used as is.
Having highlighted the best player, it seems fair to show the data for the lowest-rated player.
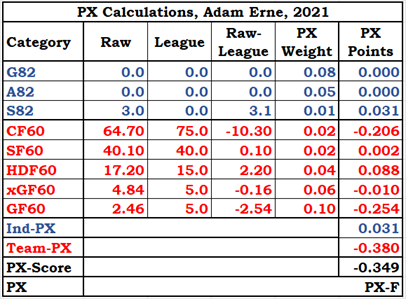
I mean no disrespect to Mr. Erne. He was on the second power play unit for Detroit, a team that was 27th in the league in terms of power play goals scored per 60 minutes.
In 2021, Erne scored six goals in 79 games. How he managed to snag 73 minutes of powerplay time is explained by the phrase “second unit powerplay for Detroit.” If they had players like Pavel Datsyuk or Henrik Zetterberg available, Erne would have been on the bench during powerplays, if not in Grand Rapids.
Distribution of Powerplay Index by Category
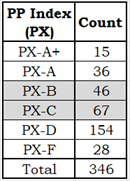
346 players qualified for a powerplay index. 266 forwards and 80 defensemen. A normal breakdown of 350 players would have 210 forwards and 140 defensemen. We learn nothing new from this: powerplays usually feature four forwards and one defenseman.
The 346 players were actually 344 individuals, two of whom qualified for two teams. Claude Giroux was one of the two, and there will be more on him later.
What do you have to do to get rated PX-F? It’s more what you have to not do. You have to not score or shoot, and your team statistics have to be below 75% of average. Ten of the 28 PX-F players played on Montreal, Detroit and New Jersey. Interestingly, three PX-F players were on Nashville, which had a top-five team powerplay. The Predator’s second unit powerplay was clearly a large step down from the first unit.
The Cream of the Crop
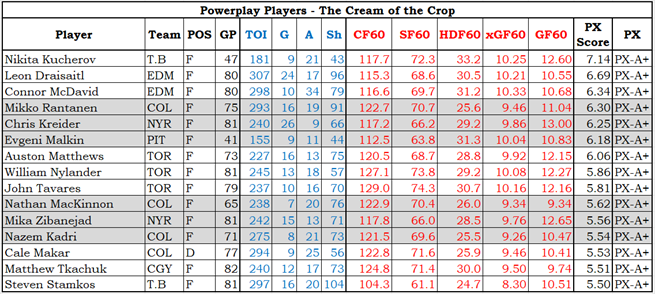
Blue columns represent individual accomplishments: TOI is time-on-ice, G and A are goals and assists, Sh is shots. Red columns represent team accomplishments while the player was on the ice: CF60 is Corsi-For (Corsi means shot attempts), SF60 is shots for, HDF60 is high-danger chances for, xGF60 is expected goals for, and GF60 is goals for.
One of the easiest ways to determine whether a new ranking system works is to review its results subjectively. Who are the surprises at the top of the list, and is their inclusion merited? What expected players are missing from the top, and is their exclusion merited?
I don’t think that there are any surprise inclusions in the PX-A+ category: they had great individual and team accomplishments.
With respect to exclusions, there are a few that need to be considered. Crosby, Pastrnak, Panarin and Marner are missing. Ovechkin is missing. Where are the Predators (fifth best powerplay)? Where are the Blues (second best powerplay)? Where are the defensemen?
With respect to Crosby and company, they were at or near the top of the PX-A category. There will be more on Ovechkin later.
Three Predators rated PX-A. The Blues spread out the scoring on their powerplay, which leveled the PX-Scores of all their players.
Most defensemen don’t score much, even on the powerplay, and most powerplays don’t use two defensemen. Their exclusion from the list isn’t precisely merited, but it is explainable.
The Best of the Rest
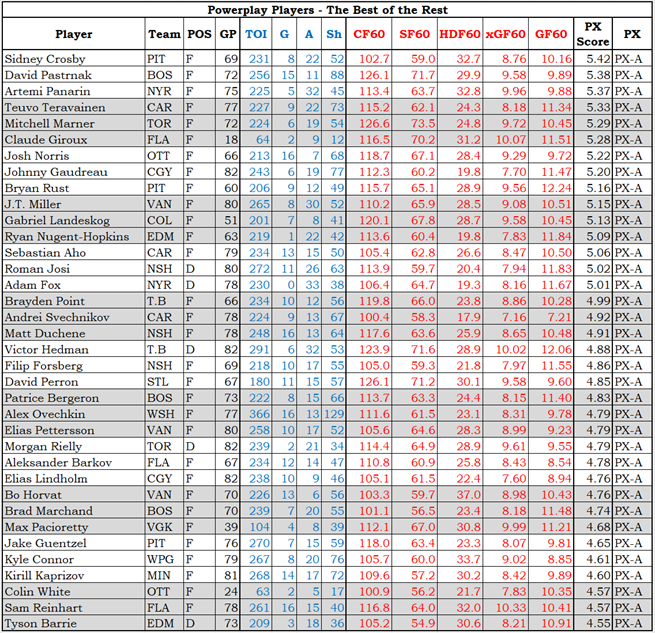
Let’s continue evaluating Powerplay Index, this time looking at a player who was not in the PX-A+ category. Ovechkin was PX-A (PX-Score 4.79), a rating that does not fit in with his press clippings. He scored 16 goals and had 29 points on the powerplay, but he also had 366 minutes of powerplay time. The PX formula uses per game and per 60-minutes data, reducing the impact of his raw statistics.
If the other 345 players who qualified for PX evaluation had played 366 minutes and scored at their same paces, Ovechkin would have been 47th in powerplay goals scored, 119th in points. Those are not A+ numbers.
Now, look at Ovechkin’s team data. In terms of Corsi (CF60, shot attempts), Ovechkin is 51st out of the 51 players who ranked PX-A or PX-A+. Ovechkin gets a lot of shots on powerplays, so his team must get a lot of shots. Right? Wrong. His SF60 is 49th. Does Washington get a lot of high-danger chances? No, his HDF60 is 50th. As to team scoring, Ovechkin ranks 51st in both expected goals scored and actual goals scored (xGF60, GF60).
Ovechkin is in the middle of the PX-A category because of the shots he gets. He’s not adding shots to their powerplay, he’s taking shots instead of the other players on the powerplay. If he had a “normal” amount of shots for his ice time he’d be in the PX-B category.
A Tale of Two Cities
Claude Giroux had two powerplay ratings last season, as he had enough powerplay time for both teams he played for. His PX ratings were quite different.
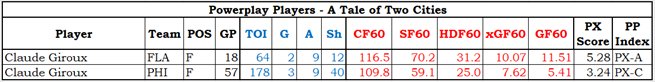
Giroux was not a different player in Florida; it was his teammates that were different players. This demonstrates two key factors about powerplays.
First: the better powerplays normally feature several good players (Florida) rather than one good player (Philadelphia). In Philadelphia, Giroux played 39 more games but had one more powerplay point. Florida had three PX-A players and three PX-B players; the best Philadelphia could do was three PX-C players. Florida’s top six players (including Giroux) were better than ANY Philadelphia player (including Giroux).
Second: one player cannot significantly improve the performance of his teammates. While Giroux did not get the Flyers powerplay to the same level as the Panthers powerplay, he did improve it. With Giroux on the ice, the Flyers scored 5.41 goals per 60 minutes. With Giroux on the bench or in Florida, they scored 2.94 goals per 60 minutes. Giroux unquestionably “helped his teammates play better” in Philadelphia, but his help brought the league-worst powerplay to a below-average powerplay. When he was on the ice. In Philadelphia.
Summary
Powerplay Index (PX) accurately categorizes players based on a subjective evaluation. Players that should have been at or near the top were at or near the top, and players that should not be in the top are not in the top.
As in school, the top category (PX-A+) is hard to achieve while the lowest category (PX-F) is more of a judgement on a player’s powerplay skills than on his person. There are far worse things in life than being an ineffective player on an NHL powerplay.
High-ranked PX players tend to come from teams with better powerplays, while teams with poor powerplays do not have high-ranked players. Toronto, which had the best powerplay, had three PX-A+ and two PX-A players. Edmonton and the New York Rangers both had two PX-A+ and two PX-A players. Philadelphia, Arizona and Seattle produced a total of one player as high as PX-B.
Evgeni Malkin was a PX-A+ player for Pittsburgh, which was 18th in powerplays as a team. Malkin played 41 games, and the powerplay was humming when he was on the ice, scoring 10.83 goals per 60 minutes. Pittsburgh’s powerplay scored 7.2 goals per 60 minutes when Malkin was not on the ice.
In the Powerplay Teams article, amongst other things I will talk about:
- Toronto, because the top powerplay in the league deserves coverage, even if it plays out of the wrong city.
- Colorado, who had four PX-A+ and one PX-A player but is not in the top five powerplays.
- St. Louis and Ottawa, a tale of two cities.
- Washington who ranked 21st on the powerplay despite having a player named Alex Ovechkin.
- Philadelphia, who’s powerplay lacked power the way mashed potatoes lack spiciness.