
Originally there was to be one article on powerplays, but after examining the data I determined that two articles were appropriate. Team powerplays are influenced by the players, and player statistics from powerplay time are influenced by the team. In a first for Stapled To The Bench, the first paragraph of two articles is identical.
The other article is Powerplay Players. It describes how Powerplay Index (PX) is used, and players’ PX grades will be cited frequently in this article.
Evaluating Powerplays
I decided to use powerplay goals per 60 minutes (PPG60) instead of powerplay percentage (PP%) to rate team powerplays, because PPG60 can be used in ways that PP% cannot. For example, I can compare goals per 60 minutes on the powerplay with goals per 60 minutes at even strength. I cannot compare powerplay percentage with even-strength percentage as “even-strength percentage” does not exist. It sounds strange, too.
Is PPG60 a good statistic? The answer is in the following chart, which shows PPG60 and PP% for all 2021/2022 teams. The teams were sorted by PPG60, highest to lowest.
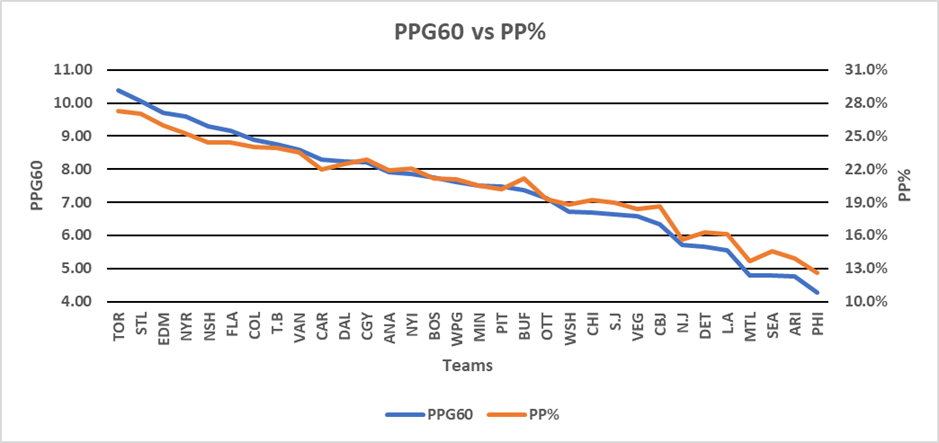
If a team has a good powerplay percentage, it has a high PPG60. If a team has a low PPG60, it has a low powerplay percentage. PPG60 is at least as valid a measure of a team’s powerplay as is PP%.
Ranking Teams on PPG60
This article will take a look at several teams, for different reasons.
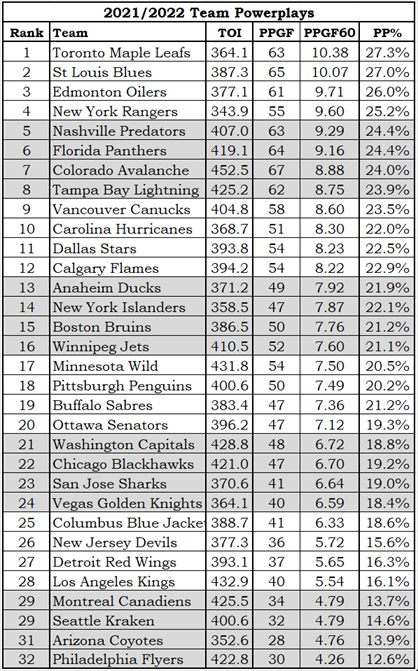
Toronto had the best powerplay.
Colorado had the best powerplay players but not the best powerplay.
St. Louis and Ottawa had similar first-unit results but vastly different team results.
Washington had Ovechkin but ranked 21st. Philadelphia had the worst powerplay.
Toronto
I had to take off my Ottawa Senators jersey while writing this section.
Toronto had the best powerplay in the league, scoring 10.38 goals per 60 minutes (PPG60). Auston Matthews, William Nylander and John (Pajamas) Taveras were all PX-A+, while Mitchell Marner and Morgan Rielly were PX-A. Only three other Toronto players qualified for PX evaluation, and they were all PX-D.
For Toronto their top five did the vast majority of the work, each of them being on the ice for two-thirds of Toronto’s total powerplay time. Given how effective they were and how little powerplay time Toronto had, what else would you do?
Under what circumstances would it have been a good idea to take a penalty against the Maple Leafs? In two minutes of powerplay time, the Leafs averaged 0.35 goals. For it to be reasonable to take a penalty, you would have to be preventing a scoring chance that would be successful 35% of the time. When does a player have the ability to take a penalty when the opponent has a 35% chance of scoring, but doesn’t have the ability to legally prevent that chance? During a goal-mouth scramble? Maybe to prevent a breakaway?
While it id always bad to take a stupid penalty, it was really stupid to take a stupid penalty against Toronto.
Now I can put my Senators jersey back on. It is the black one with the word SENS across the chest (also known as the best Senators jersey) and it has my name and number on it.
Colorado
Colorado’s top five powerplay specialists were Mikko Rantanen, Nathan MacKinnon, Nazem Kadri, Cale Makar and Gabriel Landeskog. All but Landeskog (PX-A) were PX-A+.
Ignoring the plus signs, their top five powerplay specialists were AAAAA. Toronto was the only other team that could claim AAAAA, but Toronto’s PPG60 was 10.38 and Colorado’s was 8.88, a difference of 1.50 PPG60. Why such a difference?
It was probably because Colorado had a huge edge in powerplay time over Toronto, 452.5 minutes over 364.1. Toronto’s second unit got about 33% of the powerplay time while Colorado’s second unit got 42%, and Colorado’s second unit was worse than Toronto’s.
Colorado’s team powerplay was worse than Toronto’s because their second unit was worse and their second unit played a bigger percentage of the time.
A Tale of Two Cities – St. Louis (2nd) and Ottawa (20th)
Ottawa’s top five powerplay specialists had a combined rating of AABBB, while St. Louis had a combined rating of ABBBB. All five of Ottawa’s players had a higher rating than their counterparts in St. Louis. Yet Ottawa’s PPG60 was 7.12 and St. Louis came in at 10.07. How did St. Louis get a PPG60 2.95 higher than Ottawa when their top five players were marginally lower rated than Ottawa’s?
Ottawa’s top five had 37 goals and 50 assists; St. Louis’s top five had 38 goals and 53 assists. The difference is slim: one goal and four points. Ottawa’s top five took 236 shots while the St. Louis pentad took 187. PX uses shots-taken in its formula, so that gives the Senator top-five a rating-system advantage.
Ottawa’s top five generated a lot more high-danger chances (33.1 per 60 minutes versus 19.6), but St. Louis’s top five generated more actual goals (11.4 per 60 minutes versus 9.4). Obviously, actual goals scored are more important than high danger chances, and the PX formula weight for team goals scored (0.10) is higher than that for high danger chances (0.04). The average Ottawa player got 0.56 more PX-Points for their high danger chances, while the average Blues player got 0.20 more PX-Points for their goals scored. Another rating-system advantage to the Senator players.
The real difference between Ottawa and St. Louis is in the second powerplay units. Ottawa’s second unit players had 3 goals and 32 assists, while St. Louis’s second unit had 25 goals and 58 assists.
Ottawa had a very good first unit and a poor second unit, while St. Louis had a very good first unit and an excellent second unit. One impression I get from the data is that the St. Louis main powerplay was more of an eight-man unit than a five-man unit. They had plenty of options of who to put on the ice.
Washington
How does a team with Alex Ovechkin on it end up in the middle of the league in the strength of its powerplay?
Looking hard at Ovechkin’s data, it would seem that his reputation as a powerplay superstar is inaccurate. He is a powerplay star: a PX-A player, possibly a PX-B player. I looked back at 2017 (Stanley Cup season), 2019 and 2020: he was PX-A, PX-B and PX-B. At this stage of his career, he is charitably a PX-A player.
There are teams with a single PX-A player that are among the top at the powerplay in the league. For one example, the recently mentioned St. Louis Blues spring to mind. The Blues first-unit powerplay had a combined rating of ABBBB. Washington’s first-unit powerplay rated ABCCC.
Washington has a middle of the pack powerplay because Ovechkin is at best a PX-A player, and the other first-unit players are on the weak side. As a result, their powerplay scored 6.72 goals per 60 minutes compared to the league average of 7.45 goals.
Philadelphia
While the Flyer powerplay was poor, two facts should be kept in mind. One is that some team had to have the poorest powerplay, and the other is that the NHL is the best hockey league in the world.
Philadelphia rated last simply because they didn’t score powerplay goals. It’s not that they didn’t have chances, but that they didn’t capitalize on their chances.
The Flyer powerplay PPG60 was 4.26 while the league average PPG60 was 7.45.
The Flyers averaged 94.2 shot attempts (Corsi) per 60 minutes. Washington and San Jose both averaged 94.7 shot attempts yet had PPG60 of 6.72 and 6.64.
Philadelphia averaged 52.1 shots per 60 minutes. Chicago averaged 51.9 shots and had a PPG60 of 6.70.
Philadelphia averaged 21.1 high danger chances per 60 minutes. So did Vancouver and Colorado, who had PPG60 of 8.60 and 8.88.
Philadelphia averaged 6.73 expected goals per 60 minutes. The Islanders: 6.74 expected goals; PPG60 of 7.87.
Teams that had similar opportunities turned those opportunities into goals more frequently.
Here’s a new statistic for you: expected goal conversion rate (xGCR), calculated by dividing the goals a team actually scored by the goals they were expected to score. Philadelphia’s xGCR on the powerplay was 63.3%, easily the worst in the league.
How do they fix this problem? I do not have the slightest clue.
Summary
For a team to have a good powerplay, they either need a fantastic five-man unit (Toronto) or an excellent eight-man squad (St. Louis). A great primary unit that lacks a capable second unit will reduce the team’s overall powerplay productivity (Colorado, Ottawa). The reputation of a player means nothing on the powerplay (Washington). Having good chances on the powerplay is less important than converting those chances (Philadelphia).