
Many of the issues I’d like to investigate require an objective player ranking system, something that says this guy’s a star, that guy’s a regular, and the guy who sat in the press box for 20 games is a fringe player. I didn’t find anything that I liked, so I created my own.
Rating Systems
A rating system is an index, which is a number generated from other numbers and a formula. As noted by Charles Wheelan in his book Naked Statistics, the “advantage of any index is that it consolidates lots of complex information into a single number.”
There are lots of indexes in sports. NFL Quarterback Rating (QBR) converts pass attempts, completions, yards gained, touchdowns and interceptions into a number. In MLB, Wins Above Replacement (WAR) has a very complicated calculation to produce its number. For golfers, your handicap is an index.
Now, indexes can be good or bad. QBR is well-used, but it is a bad index. It uses percentages rather than counts, so a player who completes 1 pass in 2 attempts gets the same reward as one who completes 22 in 44 attempts. Also, the QBR scale passes along no meaningful information, as it is on a scale of 0 to 158.3.
WAR is frequently used, and it is a good index. The value of WAR passes along meaningful information (a WAR of 3 means the player will produce three more wins than a replacement-level player). A golf handicap is a good index with a meaningful scale (shots), but my handicap (18 last year on a forgiving course) is bad.
Player Rating System For Stapled To The Bench
I was inspired to do this after re-reading a Bill James (baseball analyst) article on “Approximate Value.” Clearly, I couldn’t call my index Approximate Value. A good friend recommended “Productivity Rating” (PR for short), and that sounded perfect to me.
The basic process of creating the PR system was to select statistics, assign weights to them, add them all up, and then determine if the rankings made sense. Players like Connor McDavid, Leon Draisaitl and Auston Matthews had to be at the very top of the list. Players like Jake Guentzel and Justin Faulk had to be towards the top of the list, but not at the top itself: they are good players, but they aren’t in the top thirty in the league. Players like Milan Lucic and Wayne Simmonds had to be nowhere near the top of the list: those guys are fourth-liners (at best). Defensemen and forwards had to be proportionally represented throughout the list.
It is more than a little ironic that the “objective” rating system had to be perfected by “subjective” evaluations.
Statistics Used To Calculate Productivity Rating
PR is a season-level statistic, so I needed season-level statistics to calculate it. I found those statistics on a great website: NaturalStatTrick.com. I also found that the more detailed statistics are only available from the 2007/2008 season, so it is impossible to calculate the PR of Wayne Gretzky or Mario Lemeiux or Sheldon Kannegiesser.
The twelve statistics used for PR are:

Corsi is a shot-attempt-differential statistic: if you are on the ice for 12 of your team’s shot attempts, and 9 of the opponent’s shot attempts, your game personal Corsi score is +3 (12-9). PR uses Team-relative Corsi, so that good players on bad teams, and bad players on good teams, are valued correctly. For example, Thomas Chabot (OTT) has a worse personal Corsi than Radko Gudas (FLA), but Team-Relative Corsi rewards Chabot way more than Gudas.
If you think another statistic should have been used, please see the article Statistics Not Used For PR, which explains why some other statistics were not used.
Counts Vs. Rates
It is critical to note that the PR formula uses counts instead of rates or averages. For example, let’s consider time on ice. If the formula used minutes played per game (mpg), then Ryan Ellis (4 games, 91 minutes, 22.75 mpg) would get basically the same reward as Rasmus Andersson (82 games, 1,859 minutes, 22.67 mpg). This is the mistake that QBR makes! By using minutes played, Andersson gets much more credit for his play.
It must be noted that using counts can results in some very good players getting a lower-than-expected PR because they missed a non-trivial number of games.
Numbers and Words
Technically, the PR formula produces a numeric score (PR-Score) on a zero to twelve-ish scale, which places a player in a PR-Category (his “Productivity Rating”).
PR has six categories, the names of which are symbolic. From bottom to top, the categories are PR-CallUp, PR-Fringe, PR-Regular, PR-First5, PR-Star and PR-Elite.
When discussing a player, I’ll almost always refer to his PR-Category. Saying that the PR-Score of Johnny Q. Leftwinger is 4.2261 can be misleading. A number like that, with all its digits of precision, gives an unwarranted impression of accuracy. It’s safer to say that Johnny Q. is a PR-Regular.
Big Five Statistics By PR-Category
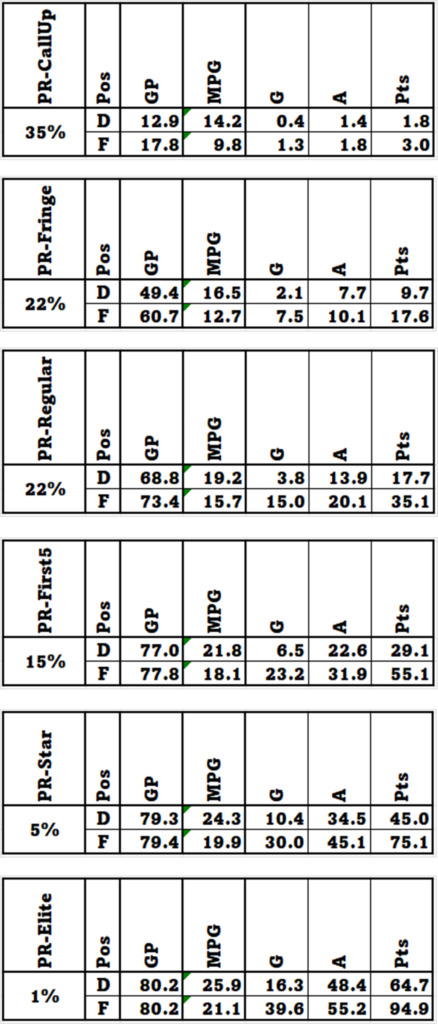
The biggest group of players is PR-CallUp. On average a team uses 10 call-ups per season. While call-ups represent 35% of the players who have played, they have only 7.5% of the ice time.
PR-Regulars represent the central group of a team: second- and third-line forwards, second-and third-pair defensemen. It wll also include the more effective fourth-line forwards. Both PR-Fringe and PR-Regular groups contain 22% of the players.
A PR-First5 player is a really good player, someone whose production would be the minimum expected of the top players on a regular team. Only 13% of forwards have scored 23 or more goals in a season.
PR-Stars are great players. Only 9% of defensemen have scored 10 or more goals in a season, and only 5% of forwards have scored 30 or more goals.
PR-Elite players are, well, elite. They are great players having great seasons, rarely missing a game. 600 players will play forward in a normal season, and only six of them will score 40+ goals. 300 players will play defense, and only three of them will get 65+ points.
Summary
PR categorizes a player based on his season statistics. In future articles, it will be used: to identify the better players in the league or on a team; to rank draft classes; to analyze the core of a team; to investigate the impact of a team’s top five players on its success. And there will be other things that pop up as time goes on.