
The Productivity Rating formula uses statistics generated by a player to produce a numeric score (PR-Score), and that score places him in one of six categories. This PR-Category will be his Productivity Rating. In this article, I’ll go through the process of calculating the PR-Score for two players.
A quick definition of the symbolically named PR-Categories can be found in Introduction To Productivity Ratings.
Just So You Know: How I Handle Shortened Seasons
The PR calculation process is amended for the shortened seasons (2012, 2019, 2020) to maintain the normal distribution of talent in the six categories. Without that adjustment, there would be no players in the PR-Elite category and precious few in the PR-Star category in the 2012 and 2020 seasons.
I will not adjust the data of a player who missed games in a season, because PR measures only what a player does. A player who played 56 games in the 2020 season played every game, while a player who played 56 games in 2021 missed 26 games.
Just So You Know: There Will Be Math In This Article
In an article that explains how the formula is calculated, math is unavoidable. It may be comforting to know that you won’t have to do any of the math.
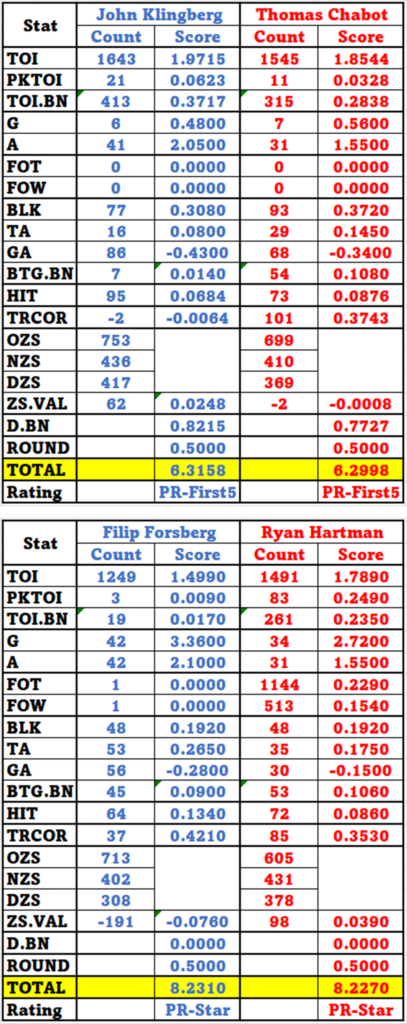
Dramatis Personae
In the blue corner, standing 6’ 3” and weighing 190 pounds, is John Klingberg (Dallas). In the red corner, standing 6’ 2” weighing 196 pounds, is Thomas Chabot (Ottawa).
PR Calculations #1 – Time Data
Players are rewarded for all time-on-ice (TOI) and for penalty-kill-time-on-ice (PKTOI). Players also earn bonus credits for all TOI above 1,230 minutes (15 minutes per game in an 82-game season).
Klingberg had 1,643 minutes TOI and 21 minutes PKTOI, while Chabot had 1,545 minutes TOI and 11 minutes PKTOI. Chabot would normally be among the league leaders in TOI, but he missed 23 games. Klingberg missed “only” eight games.
Is it fair that Klingberg gets more credit for time played than Chabot just because Chabot was injured? In the context of evaluating each player’s season, it is absolutely fair.
The PS-Score for time-on-ice is 0.0012 per minute; for penalty-kill-time-on-ice it is 0.0033 per minute; the time bonus is 0.0009 per minute played above 1,230. A table at the end of the document will show the results of each calculation.
Why are the weights (0.0012, 0.0009) so small? Because it uses season-level data and the goal was to have an excellent season have a total score of 10 when all the items are added together.
PR Calculations #2 – Scoring Data
Players get 0.08 for each goal scored and 0.05 for each assist.
The biggest portion of PR-Score comes from time played and scoring, normally accounting for 70% of the total score.
PR Calculations #3 – Face-Off Data
Defensemen normally never take a face-off, and both Klingberg and Chabot were normal. A player gets 0.0002 for each face-off taken, and 0.0003 for each face-off won.
If you think that isn’t much of a reward, a good center will take more than 1,000 face-offs in a season. Patrice Bergeron earned 0.6173 for his face-offs last season.
PR Calculations #4 – Blocked Shot, Take-Away and Give-Away Data
Three statistics lead to four calculations as a bonus is involved. The weight for a blocked shot is 0.004, for a take-away is 0.005, and for a give-away it is -0.005. (A give-away is as bad as a take-away is good). The bonus (BTG) comes from adding blocked shots to take-aways, subtracting give-aways, and multiplying the result by 0.002.
PR Calculations #5 – Hit Data
A hit earns a player 0.0012, the same as one minute of time-on-ice. While it may not seem like much of a weight, it’s more than two times the weight for winning a face-off (0.0002 + 0.0003). If you think the weight for a hit should be higher, you are wrong (in my opinion).
PR Calculations #6 – Team-Relative Corsi Data
Corsi, which is a shot-attempt differential statistic, has two portions in PR. The main part is a player’s team-relative Corsi, while the minor part his team’s Corsi (not his personal Corsi). All Corsi data comes from five-on-five ice time, so that players who play the power-play do not get unfairly rewarded, and players who kill penalties do not get unfairly penalized.
A player earns 0.004 for his team-relative Corsi shot difference and 0.0003 for his team’s Corsi. As Corsi numbers can be negative, a player can get a negative value here.
PR Calculations #7 – Defensive Zone Start Data
NHL statistics shows the number of shift-starts a player has by zone: offensive; neutral; defensive. A shift that is started while play is ongoing is a separate statistic.
A player that gets a lot of defensive zone starts has defensive skills that should be rewarded. Instead of just crediting a player based on their defensive zone starts, I wanted this category to also “penalize” a player that had a lot of offensive zone starts. A player who had offensive-neutral-defensive (OND) zone start counts of 200-300-400 is clearly more of a defensive player than a player whose OND is 500-200-400.
The weight for Zone Starts is 0.0004, while the count that is weighted is (three times defensive zone starts minus neutral zone starts minus offensive zone starts).
PR Calculations #8 – Defenseman Bonus
Most NHL statistics are offensive in nature and forwards tend to get the lion’s share of them.
Without a bonus for defensemen, the top ranked players would be exclusively forwards. The bonus makes up for the lack of meaningful (and freely available) defensive statistics.
The defenseman bonus couldn’t be a single one-bonus-for-all, as that would not be equitable. A defenseman who plays twenty-plus minutes a game for every game deserves a bigger bonus than one who had thirteen minutes in the only game he played.
The defenseman bonus score is 0.0005 per minute played.
PR Calculations #8 – Rounding Adjustment
This last step is a trivial one. Each player has 0.5 added to their score.
The reason for this is also a little trivial: doing this makes the PR and VR career charts look better.
Prior to adding this rounding adjustment, player categories were assigned by rounding their PR-Score. A player whose PR-Score was 5.7717 would be rounded up to 6, which would put him in the PR-First5 category (PR-Scores 6 or 7). But on the PR Career chart, which uses his unrounded PR-Score, he would be in the PR-Regular category. It drove me crazy.
By adding the 0.5 to this player, his PR-Score would be 6.2717. Again, he’d be in PR-First5 category (PR-Scores 6.0000 to 7.9999). But now, on the PR Career chart, he would be in the PR-Elite category. That makes me happy, which is amazingly important.
PR-Score to PR-Category

In Introduction To Productivity Rating it was stated that PR-Score is a number on a zero to twelve-ish scale. What that was inelegantly trying to imply was that it is an open-ended scale where the top scores since 2007/2008 have rarely exceeded 12. I think there have been three or four instances of a player getting a PR-Score above 12.0000.
As the last step adds 0.5 to every score, no player has ever received a negative PR-Score.
The Numbers
As a reminder, Chabot played fifteen fewer games than Klingberg. Had Chabot played just two more games he would have had a higher rating than Klingberg. But he didn’t play two more games, so he ranks slightly behind him.
While Klingberg had the more productive season, he was not the more valuable player.
The second table on the left shows the process for two forwards, one of whom took a good number of face-offs. In spite of the large differences between the two players in many of the statistics, their PR-Scores are practically identical.
When there are only six categories and about 1,000 players, players of different styles will end up in the same category. There are many ways to be a regular, or even a star.
Summary
PR is a useful player categorization that is based on fourteen player statistics. PR-Score is a detailed rating of a player (6.3158, for example) while PR-Category is a symbolic representation of that score (PR-First5, for example).
PR will be used in articles that look at a player’s productivity. Please see the article Introduction To Value Rating for more information.