
When I started Stapled to the Bench, I had a very good rating system for players (Productivity Rating – PR) and no rating system for goalies. I figured I’d get around to creating a goalie rating system eventually.
Eventually, I created two goalie rating systems. My first effort, Goalie Rating (GR), was satisfactory if a little naive. Its calculation was dead easy (xGA – GA) and could be used to evaluate careers. See the end of this article for a glossary for terms and their definitions.
My second effort, Goalie Expected Points (GxPts), is a much better evaluator of goalie performance over a season. Its calculation is more complicated, as it uses xGA, GA and TOI (Time On Ice) and converts them to the record an average team would have with him in the nets.
Now that I have a satisfactory season-level goalie rating system, I will use it as the basis for determining which goalies belong in the Regular Season Hall of Fame (RSHOF).
What Does a Regular Season Hall of Fame Goalie’s Career Look Like?
This is an important question, as the answer will determine how the statistics at hand should be used. In my opinion, a Hall of Fame goalie’s career will have been long and effective career with several seasons where he was one of the top goalies in the league. A goalie should not get into the RSHOF just because he has had a long career, nor just because he had a couple of good seasons.
GxPts is the statistic I will use to “measure a season”. The more GxPts a goalie has in a season, the better that season was. GxPts cannot be used directly, as GxPts scores have been decreasing since 2007-08.
Are Goalies Worse in 2023-24 Than They Were in 2007-08?
I put it to you that goalies are obviously better now than they were sixteen seasons ago, given they have better equipment and better training, but GxPts does not reflect that.
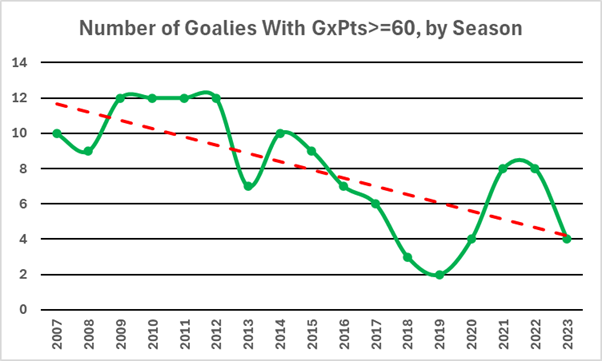
The green solid line shows the number of goalies whose GxPts was at least 60.0, while the red dashed line is the green line’s trendline. This drop in GxPts is not caused by goalies playing worse, and it is not caused by an increase in scoring in the league. It is caused by goalies being used differently.
How Has Goalie Play Changed Since 2007-08?
The chart below shows that #1 goalies (the goalies with the highest TOI for their team) have gradually seen their share of ice time reduced, while #2 goalies (the goalies with the second-highest TOI for their team) have been picking up most of those minutes.
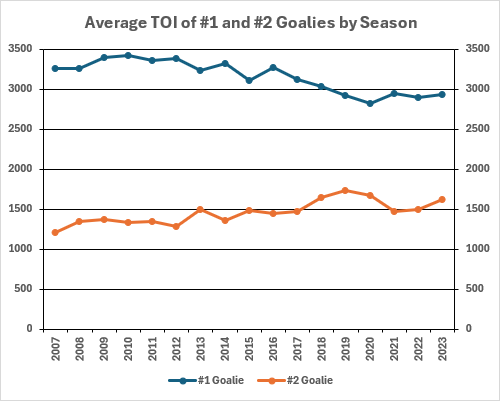
This more-even distribution of minutes to goalies has an impact on GxPts. To give you an idea of the impact this change has had, let me walk you through the GxPts calculations of Ilya Bryzgalov (ANA & PHX, 2007) and Cam Talbot (L.A, 2023-24).
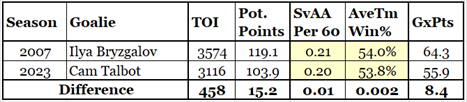
The first data column, TOI, shows that Bryzgalov played 458 more minutes than Talbot. Because of that, his potential points (Pot. Points) are 15.2 higher.
In SvAA60, which saves above average per 60 minutes of ice time, the two goalies are practically identical. Both goalies save their teams one goal against every five games.
As their SvAA60 data is practically identical, their “average team’s winning percentages” (as calculated by the Pythagorean Win Percentage formula) are practically identical. The formula for AveTmWin% is below, with GF60 and GA60 being goals for and goals against per 60 minutes.
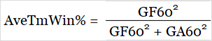
GxPts, the goalie-season rating, is calculated by multiplying a goalie’s average team winning percentage and his potential points. Bryzgalov’s GxPts (64.3) is 8.4 higher than Talbot’s (55.9) because he had more time on ice.
Is it fair that Bryzgalov has much higher GxPts than Talbot, given that they are essentially equal in terms of goals saved per game? Yes, it is extremely fair. GxPts is designed to rank goalies within a season. I never gave a thought to how GxPts would be used across seasons when it was being designed.
Now all I have to do is figure out how to use GxPts as the basic statistic for evaluating a goalie’s career, given that GxPts is in a state of decline for #1 goalies.
How Can GxPts be Used for RSHOF Calculations?
The GxPts of Top Ten Goalies table shows goalies from two seasons (2007-08 and 2023-24) sorted by GxPts. Rows with goalies from 2023-24 are shaded in blue.
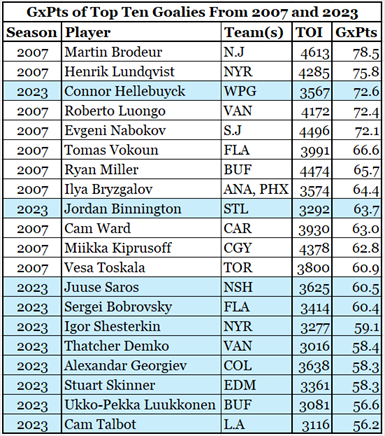
As has just been discussed, the 2023-24 goalies are at a bit of a disadvantage in terms of GxPts.
What are the characteristics of a Hall of Fame career for a goalie? They should have long careers and should have been one of the best goalies in the league in several seasons.
In 2007-08, the best goalies were Brodeur, Lundqvist, Luongo and Nabokov. In 2023-24, the best goalies were Hellebuyck, and, charitably, Binnington.
The critical idea is to convert GxPts, whose values for #1 goalies has been descending since 2007-08, to “Hall of Fame Points” (HFPts), which will have consistent values from season to season. In each season, the goalie with the highest GxPts will get 100 HFPts, and all other goalies will get fewer HFPts based on how close they were to the league leader. HFPts will be a whole number (no fractions).
“Hall of Fame Bonus” (HFBns) points are awarded based on a goalie’s HFPts. There are four levels of bonuses: 100 points if HFPts is at least 90, 75 points if HFPts is between 90 and 75, 25 points is HFPts is between 75 and 60, and zero points if HFPts is below 60. By the way, most goalies (90%) get zero for HFBns in any given season.
Finally, RSHOF.Score is a goalie’s career rating statistic. RSHOF.Score is the sum of a goalie’s season-level HFPts and HFBns. Its value will determine whether a goalie is enshrined in the RSHOF or is required to pay admission to enter the RSHOF, as the rest of us would have to do if the RSHOF were a real place. The following table shows the same 20 goalies from 2007-08 and 2023-24, but they are now sorted in order of HFPts and HFBns.
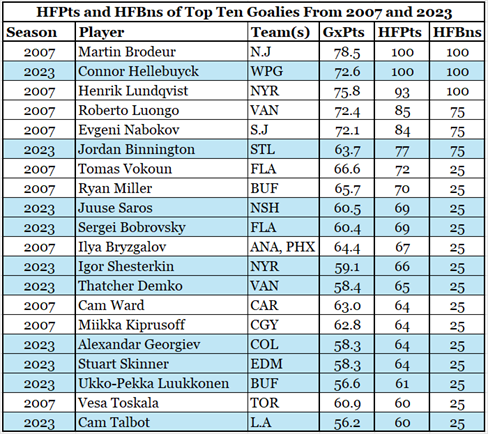
The top two rows show that the best goalie in each season got 100 HFPts and 100 HFBns. Rows three to five have three goalies from 2007, whose performances were quite close to Brodeur’s. Lundqvist got a 100-point bonus as his HFPts are above 90, while Luongo and Nabakov each got 75 bonus points.
Row six has Jordan Binnington, the second-best goalie from 2023. His HFPts and HFBns are those of a goalie who had a really good season, but not a great season (compared to Hellebuyck). The second, third and fourth-best goalies in 2007 were all closer to Brodeur than Binnington was to Hellebuyck.
How Was the RSHOF.Score Cutoff Value Determined?
The “cutoff value” is the minimum career RSHOF.Score a goalie requires to be enshrined in the RSHOF. It was determined based on a desire to have the cutoff be a round number.
Having a cutoff value such as 683 would imply a level of accuracy in the RSHOF process that is not merited. While I believe that RSHOF.Scores are reasonable, they are certainly not accurate to three digits of precision (in 683, the “3” is the third digit of precision). Where goalies have RSHOF.Scores that are far from each other, the goalie with the higher RSHOF.Score will be the better goalie. Where goalies have career RSHOF.Scores that are close to each other, either one with could be the better goalie.
I decided to let RSHOF.Score tell me what the cutoff value was, hoping that there would be a “handful” of goalies above the cutoff value: five-ish goalies, if you want a precise number. Five-ish goalies would be an appropriate representation of goalies, given the number of skaters that are in the RSHOF.
As it turned out, the top six goalies all had Career RSHOF.Scores above 1,100, while the goalie in seventh place had a Career RSHOF.Score of 871. That tells me that the RSHOF criterion for goalies was a minimum Career RSHOF.Score of 1,000.
Was STTB Influenced by Goalie Names in Determining the Rules for Which Goalies Are in the RSHOF?
This is a very reasonable question. I get my data from NaturalStatTrick.com, and the only player identifiers the site provides are their names. To ensure I wasn’t dazzled by a goalie’s press clippings, and to ensure I wasn’t going out of my way to penalize goalies who played for the wrong team (Toronto, Boston or Philadelphia), I assigned each goalie a unique numeric identifier and changed the team(s) they played for to “Team” before I started work on developing the RSHOF.Score formulas and tables.
When I got to looking at career RSHOF.Scores, I was looking at data that looked like the following table.
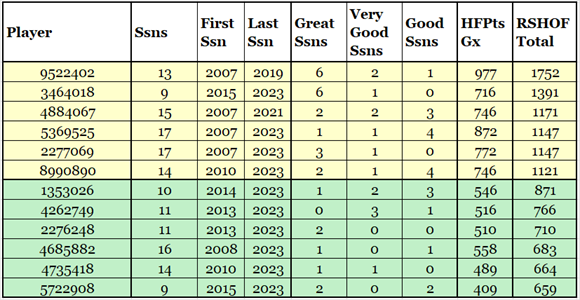
If I’m being completely honest, I was pretty sure who the top two goalies were given their standing in the list and their first and last-season data. You also know who those two goalies are, don’t you?
Now, the only real way to determine the correctness of this objective process (the data-driven approach with all its formulas) is to verify its results subjectively (by confirming that “the correct players” are at the top of the list). If all of this work ended up identifying Pekka Rinne as the best goalie since 2007-08, I think we’d all agree that the process was wrong.
When I now looked at the names of the goalies on the list, I was relieved to see that the “correct goalies” were at the top of the list.
Which Goalies Are Being Added to the RSHOF?
In the table below, the RSHOF goalies are in the yellow-shaded rows. The goalies in the green-shaded rows are those who played last season and are the closest to meeting the RSHOF standard. Some goalies had a career RSHOF.Score above 659 but did not play last season, so they aren’t on the table. They are Pekka Rinne (863), Braden Holtby (839), Cam Ward (765), Ryan Miller (725), Mike Smith (692) and Roberto Luongo (691).
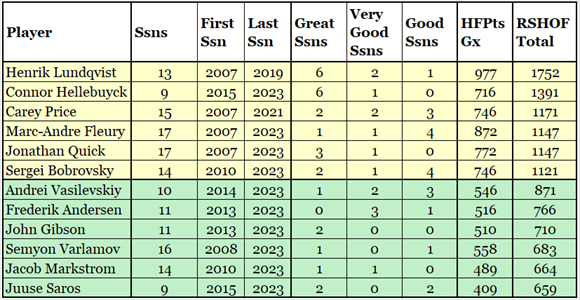
My goal was that RSHOF goalies should have long careers and should have been one of the best goalies in the league in several seasons. By extension, goalies who had long careers but were usually not among the league’s best goalies should not be in the RSHOF.
Tukka Rask and Carey Price both had fifteen-season careers, but Tuukka is not in the RSHOF while Price is. Rask had zero great seasons, zero very good seasons and four good seasons for an RSHOF.Score of 628. Rask’s best season (2013-14, probably) would be Carey Price’s seventh-best season.
Also, by extension, goalies who had a couple of good seasons in a short-ish career should not be in the RSHOF. While Pekka Rinne had two very good seasons and three good seasons, he had nine other seasons that were quite pedestrian in terms of RSHOF-level play. His career RSHOF.Score is 863, leaving him outside the RSHOF.
Is There a Chart That Shows a Goalie’s Career?
Of course, I have a chart that shows a goalie’s career. It is called the “Career HFPts” chart. Below you’ll see the charts of the six RSHOF goalies, who are presented in RSHOF.Score order.
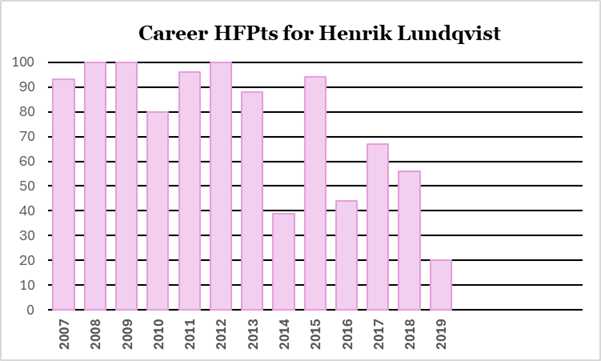
Lundqvist earned his RSHOF membership after the 2012-13 season.
Lundqvist was the dominant goalie in the NHL from 2007 through 2015, posting six great seasons and two very good seasons.
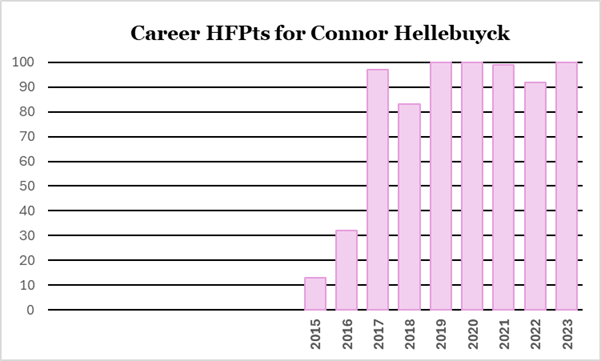
Hellebuyck earned his RSHOF membership after 2022-23.
At the end of the 2021-22 season his RSHOF.Score was 999, putting him just outside the RSHOF. Had his career ended at that moment in time, he would not be a Hall of Fame goalie, because 999 is less than 1,000.
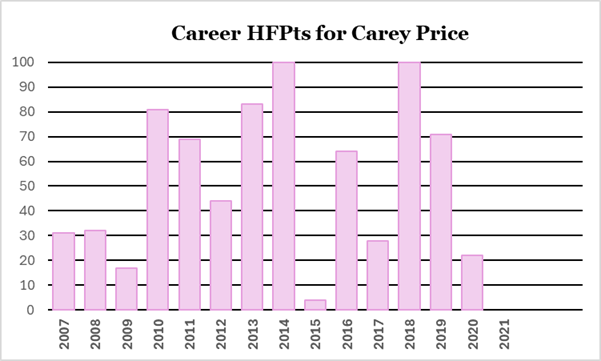
Price earned his RSHOF membership after 2018-19. Injuries are a bitch. It is quite possible that Price would have had the best goalie career of all time (since 2007) had he been healthy throughout his career.
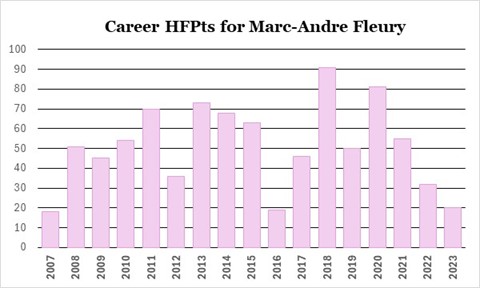
Fleury earned his RSHOF membership after 2020-21.
Of all the goalies in the RSHOF, Fleury is the goalie with the highest percentage of his RSHOF.Score coming from HFPts. He has had one great season, one very good season and four good seasons.
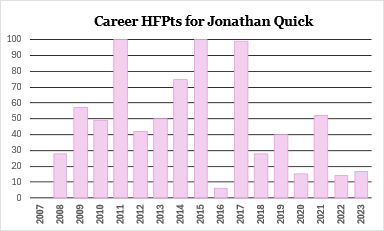
Quick earned his RSHOF membership after 2018-19.
From 2011 through 2017 he was one of the best goalies in the league, with three great seasons, one very good season, one back injury (2012) and one lower-body injury (2016).
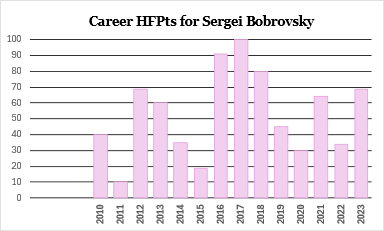
Bobrovsky earned his RSHOF membership after 2022-23.
He has had two great seasons and one very good season (2016 to 2018), along with four good seasons.
What Other Wisdom Can Be Gleaned From the Career HFPts Charts?
Goalies have a lot of season-to-season fluctuation in their careers.
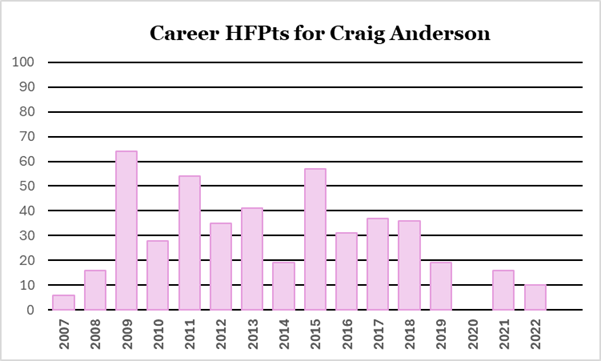
In Ottawa, one frequently would hear that Craig Anderson would have one good season and then one bad season: specifically, that he played well in odd seasons (2011, 2013, 2015) and poorly in even seasons (2010, 2012, 2014, 2016). As his Career HFPts chart shows that wasn’t literally true but it was figuratively true. His better seasons were always followed by a lesser season.
The reasons for season-to-season fluctuations in goalie performance are their health and a human’s general tendency to regress towards the mean.
Obviously, an injured goalie cannot possibly play as well as a healthy goalie. Injured goalies either play poorly or play less, both of which will reduce their GxPts.
As to “regressing towards the mean”: nobody can always play at their peak level. Heck, nobody can consistently play at their average level. I laugh when I hear somebody say, “We just need our goalie to play at his average level in every game.” They may as well say, “I have no idea what the word average means.”
Your average at any game you play is probably near the mid-point of your range of scores. My average golf score is around 90, but my scores range between the low 80s and the mid-100s. I cannot always score 90 or below, because I am human. This is also true of professional golfers, although they have a different range of scores (mid-60s to upper 70s). No professional golfer is going to shoot 70 or better every single round.
(Brag: when I was in my early 60s I shot 75 once.)
Who is the Next Goalie That Will be Inducted to the RSHOF?
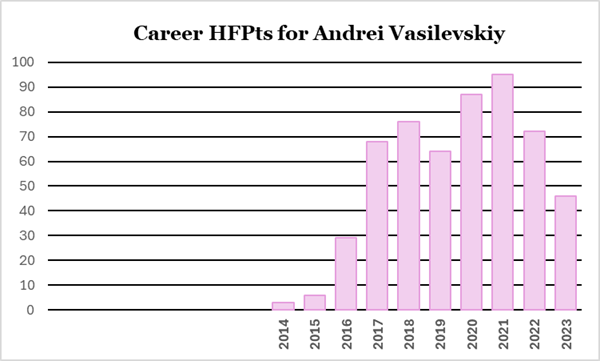
Here are the top six goalies not currently in the RSHOF.
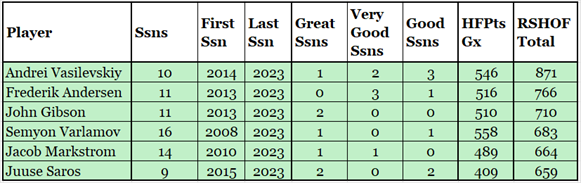
Andrei Vasilevskiy is the most likely goalie to be the next goalie to earn his membership in the RSHOF: he is one very good season away. It is worrying that his HFPts have dropped the last two seasons, but he’ll be okay if those were the normal career fluctuations of a goalie.
Of the other five goalies, Juuse Saros strikes me as the next favourite. I don’t believe Andersen or Gibson have anything left in the tank, Varlamov rarely had anything in the tank, and Markstrom can only find his tank in one of every three seasons.
Summary
As all of the other section titles were questions, it seemed silly to stop now.
The Regular Season Hall of Fame will be expanded, as the careers of goalies can now be reasonably evaluated. RSHOF.Score recognizes goalies who had long careers which featured great seasons.
The first wave of goalies being honoured are Henrik Lundqvist, Connor Hellebuyck, Carey Price, Marc-Andre Fleury, Jonathan Quick and Sergei Bobrovsky.
Andrei Vasilevskiy is the most likely goalie to be the next goalie enshrined in the hall.
Glossary
| Term | Definition |
|---|---|
| AveTmWin% | Average Team Win Percentage – How frequently an average team would win a game with a specific goalie in the nets |
| GA | Goals Against - Number of goals scored against a goalie (or team). |
| GR | Goalie Rating - An earlier STTB Statistic for rating goalies. A new statistic, GxPts, is now preferred. |
| GxPts | Goalie Expected Points - Estimated points an average team would get with a specific goalie in nets, based on the goalie’s xGA, GA and TOI. |
| HFPts | Hall of Fame Points - Points awarded to a goalie in a season, based on his GxPts and the league leader's GxPts. |
| HFBns | Hall of Fame Bonus - Bonus points awarded to a goalie based on HFPts. |
| RSHOF | Regular Season Hall of Game - An STTB invention that recognizes the best players in the NHL. |
| RSHOF.Score | RSHOF Score - The sum of a goalie's HFPts and HFBns from every season of his career (since 2007-08). |
| STTB | Stapled to the Bench |
| SvAA60 | Saves Above Average per 60 minutes. Goals Against Reduced, if you will. |
| TOI | Time On Ice - Amount of time a player was on the ice, in minutes. |
| xGA | Expected Goals Against - Estimated number of goals a goalie should have given up, considering the number and quality of shots he faced. |
Related Articles