
I had been looking for play-by-play data for years now but had found nothing: I finally struck gold when I changed my search criteria (from “NHL statistics” to “NHL datasets”). This fortunate change led me to BigDataBall.com (BDB).
While BDB does not provide data for free, they are not expensive. One season’s worth of play-by-play data costs less than a twelve-pack of beer. I wanted my site to be based on data that was entirely free, but the specific cost for one season’s play-by-play data was so little that I purchased it. I sacrificed a couple of bottles of beer on the altar of research.
In my first article using play-by-play data, I will determine the value of a lead. This requires an “expected value” measurement which is based on what happens to teams that had a lead during the game.
Some Leads Are Better Than Others
This is an incredibly obvious fact so I will only spend two sentences on it, and that counts this first sentence as one of the two. A 1-0 lead in the 11th minute of the first period is not as good as a 1-0 lead in the 11th minute of the third period, and neither of those leads is as good as a 1-0 lead with 11 seconds to go in regulation.
Some Details
Detail 1: I will be looking at the size of a lead, not the score. A 3-2 lead is the same as a 1-0 lead is the same as a 6-5 lead: they are all one-goal leads.
Detail 2: I will be looking at the score in each minute. If the first goal of a game is scored in the third minute of a game, and it is then tied up in the tenth minute of the game, there was a one-goal lead from the third minute into the tenth minute.
Detail 3: I will be using only data from the 2022-23 regular season. I spend my beer money carefully.
Detail 4: Four-goal (or better) leads were bulletproof in 2022-23, so this article will only look at the smaller leads.
Detail 5: While this article focuses on teams that are leading, I have also calculated the expected value of deficits and ties.
Calculating a Lead’s Value: Score-Based Expected Points (SBxP)
A unit of measurement is needed for the value of a lead. It will be called Score-Based Expected Points (SBxP) and it shows how many standing points a team usually gets given the score and the time of the game.
Calculating SBxP – An Example
In the 11th minute of the first period, 617 teams had a one-goal lead. Those teams ended up with 325 regulation wins, 133 regulation losses, and 159 regulation ties. As a side note, there is no point in time when a team with a lead ended up with more regulation losses than regulation wins.
The table below shows the final results of teams that had one-goal leads in the 11th minute of each period. The last four columns show how these teams would do in 82 games, the length of a season: this puts the raw win-loss-tie data in a familiar frame of reference.
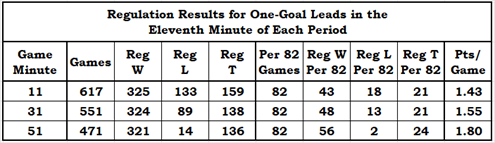
Teams get two points for a win and one point for an overtime/shootout (OT/SO) loss. The only question that remains is how SBxP should handle games that ended regulation in a tie.
In OT/SO, the team that wins gets two points while the losing team gets one point, which is an average of 1.5 points. SBxP will use 2.0 points for a regulation win and 1.5 points for a regulation tie.
The SBxP for a one-goal lead in the 11th minute is:

The table below shows the SBxP for one-goal leads in the eleventh minute of each period. The SBxP chart, which is coming up, is based on this calculation for every minute in regulation for one, two and three-goal leads.
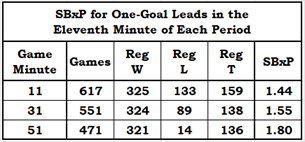
This table shows what we suspect: the later a lead is held, the better it is.
SBxP Chart
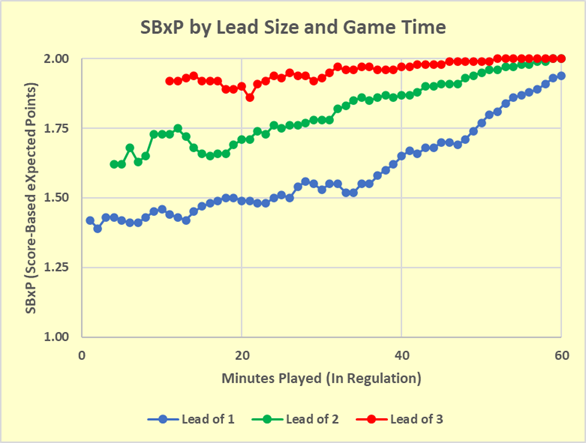
A chart of SBxP is much more informative than the underlying table, which has sixty rows and three columns.

The huge dips in the 2-goal and 3-goal lines at the start of the first period are caused by a combination of a small number of occasions when such a lead was held in combination with a comeback or two. Using only data points where at least 20 teams contributed to the calculation presents a much clearer picture, as seen below. There are still a couple of dips, but they are a less dramatic.
A Small Clarification
I’ve said that a regulation tie is worth 1.50 points, and I’ve also said that the SBxP of a one-goal lead in the eleventh minute is 1.44 points. Am I saying that a one-goal lead is worth less than a tie? No, of course not. I just haven’t told you the SBxP of a game that is tied.
Games that are tied in regulation don’t always end in a regulation tie. In most of those games, one team will win in regulation and the other will lose in regulation. The SBxP of a tie in the eleventh minute is 1.12 points, not 1.50 points.
Late in the Game with a One-Goal Lead
The next table shows how the league did with late-game one-goal leads.
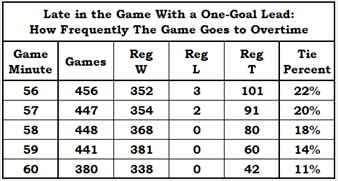
Leads are at risk based on the size of the lead and the time remaining. As a team hangs on to its lead, its chances of winning the game in regulation increase. But wouldn’t it be better for the leading team if they scored a goal and took a two-goal lead?
Two-Goal Leads: The Worst Lead in Hockey
An old myth is that a two-goal lead is the worst lead in hockey. You can disprove that myth just by thinking: has your team ever been up 3-1 and you wished they would give up a goal to make the score 3-2? Of course not.
Fortunately, the myth is also disproved by the data. The green line (two-goal leads) in the SBxP chart is consistently above the blue line (one-goal leads). There is no point in any game where a team with a one-goal lead has better prospects than a team with a two-goal lead. The worst lead in hockey is, obviously, a one-goal lead.
The only problem with a two-goal lead is that it isn’t a three-goal lead. By and large, fans think that any time a team has a two-goal lead it should win the game unless it happens to be a team that is playing their favourite team. Then their team should be able to mount a comeback because a two-goal lead is the worst lead in hockey.
And to answer the question that ended the previous section: yes, it would obviously be better for a team to take a two-goal lead late in the game.
Summary
Score-Based Expected Points (SBxP) was created to compare the value of leads with numerical precision. While we all know that leads are good, that big leads are better than small leads and that late leads are better than early leads, this article puts numbers to just how much better they are.
Along the way, the myth that a two-goal lead was the worst lead in hockey was busted: it was like shooting fish in a barrel. I sincerely hope that no hockey broadcaster actually believes that a two-goal lead is the worst lead in hockey. It’s one thing to say something stupid, given that it’s a common hockey trope; it’s entirely another thing to believe it.
The next article based on play-by-play data uses SBxP to investigate the question of who scores the important goals in a game. In that article, the concept of key goals and trivial goals will be introduced. There is one player in the league who scored a lot of trivial goals and not many key goals: why not take a guess as to who that player is before you read the article?
Related Articles