
In this list article I’ll identify Special Teams players from last season, with an emphasis on “special teams” being a plural noun. I will identify the players who get a lot of ice time on both the power-play and the penalty-kill.
There are power-play specialists. Alex Ovechkin (Washington) played an average of 285 seconds per game on the power-play last season.
There are penalty-kill specialists. Andrew Peeke (Columbus) played an average of 193 seconds per game on the penalty-kill last season.
Neither of them are Special Teams Specialists. Peeke averaged 5 seconds of power-play time per game, while Ovechkin averaged 1 second of penalty-kill time.
Careful Use of Statistics
Rather than use total power-play and penalty-kill time, I will use power-play and penalty-kill time per game played. Using these average times will allow players who missed games to be evaluated on a level footing with those who didn’t miss games.
When using “per game” data, it is important to have a “minimum play time” criterion: the list would look silly if it included guys who played a handful of games. Only players who played 820 minutes or more during the season will be included. 820 minutes is 10 minutes per game in an 82-game schedule.
I considered using 41 games as the cut off, but there are many players who play more than 41 games but play a trivial amount of time in those games. On example of such a player is Scott Sabourin, an Ottawa forward, played 53 games but only had 456 minutes of ice time.
By using the 820-minute cut off, one player who played fewer than 41 games is included (Drew Doughty, L.A. defenseman, 1,004 minutes played in 39 games), while over 100 players who played more than 40 games were excluded (sorry about that, Scotty).
492 players qualified for evaluation, ranging from Brent Burns (2,143 minutes played) to Nicklas Backstrom (822 minutes played). All 492 had at least one second of power-play time during the season, and all but one had at least one second of penalty-kill time.
How can we pick out the players who played a lot of power-play and a lot of penalty-kill time? We borrow an approach used by Bill James in his baseball writings, of course.
Power-Speed Number
Some baseball players hit lots of Home Runs (HR), and some Steal lots of Bases (SB): a precious few players do both. Power-Speed Number was designed so “that a player who does well in both home runs and stolen bases will rate high.” The formula for Power-Speed Number (PSN) is:
Yes, as most of you will recognize, PSN is the harmonic mean of the two numbers. At least that’s what Wikipedia says the formula is.

The single season record for PSN, 43.9, is held by Alex Rodriguez, who hit 42 home runs and added 46 stolen bases while playing with the Seattle Mariners in 1998. Note that “43.9” has no units: it is just a number.
PPPK Number
PPPK Number will identify the players who played the most on both the penalty-kill and the power-play, based on average seconds per game played in those situations. Its formula is identical to the PSN formula above, with different variable names: PPT means Power-play Time and PKT means Penalty-kill Time.

A couple of examples are in order. I’ve selected three players who all play close to the same amount of time on the power-play (PPT). All numbers have been rounded to the nearest whole number.
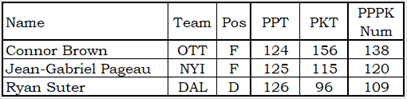
The further apart PPT and PKT are, the lower PPPK Num will be. Alexander Ovechkin had 285 PPT seconds and 1 PKT second, giving him a PPPK Num of 2. Curtis Lazar, with his PPT of 1 second and PKT of 96 seconds, has a PPPK Num of 1.
The Specialists
One player really separated himself from the pack. In an average game, Aaron Ekblad had 211 seconds of power-play time per game and 165 seconds of penalty-kill time per game. His PPPK Num is 185, while second place Brent Burns has a PPPK Num of 162. Burns is closer to the player in 22nd place (Sebastian Aho, Carolina, PPPK Num of 140) than he is to first place.
The following table shows the top 22 players in PPPK Num, along with their PR-Category. Stopping at 22 was an arbitrary decision, as the player in 23rd had a PPPK Num of 139, but a line had to be drawn somewhere.
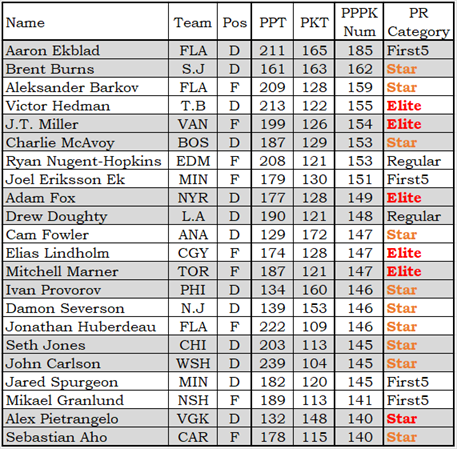
There are five PR-Elites and eleven PR-Stars in this list, and only two PR-Regulars. That is a highly valued set of players. The two players who were rated PR-Regular missed a lot of games during the season: Nugent-Hopkins missed 19 games; Drew Doughty missed 43.
Summary
PPPK Num can be used to identify players who get a lot of time on both the power-play and the penalty-kill.
The top PPPK Num players are largely excellent players. This is not a role that can be taken on by a third-line forward or a second-pair defenseman.
To show how talent-laden the Special Teams Specialists are, the chart below compares the PR-Category composition of the top 22 players (blue bars) to all 492 players who played at least 820 minutes (yellow bars).
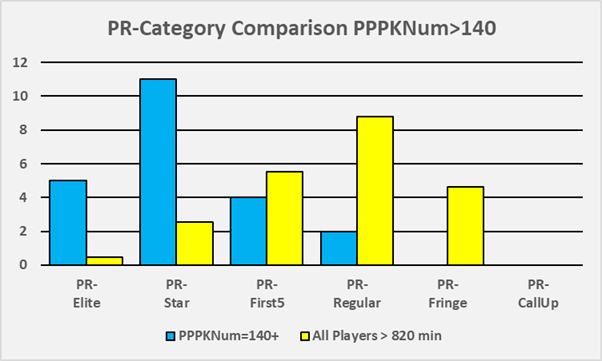
The 492-player group’s counts were brought down proportionally to 22, so that they’d fit on the chart. There were 11 PR-Elite players in the 492: the first yellow column on the left of the chart represents 0.49 PR-Elite players (11*(22/492)).
The top Special Team Specialists have ten times more PR-Elite players than the qualifying group, and four times more PR-Star players.
Because of the 820-minute requirement, the 492-player group has no PR-CallUp players. It is almost impossible for a player to play that many minutes and be rated PR-CallUp (it has happened once in the last fifteen seasons: it was a low-scoring defenseman who didn’t play much on the penalty-kill, didn’t score a lick, and had a terrible Corsi).
An interesting fact about the top players is that they come from nineteen different teams. Minnesota had two players on the list and Florida had three (Ekblad, Barkov, Huberdeau).
Does this mean that Florida was the only team that chose to use multiple players on both sets of special teams? Does it mean that Florida happens to have three players that can play a lot on both sets of special teams? That’s a question I cannot answer using data: the data shows what happened, not why it happened. The “on-the-face-of-it” answer is that Florida was blessed with three versatile players: they could use those three players that way, and they did. No other team has three players like Ekblad, Barkov and Huberdeau.
Online, you will be able to find an interactive table with the PPPK Num details of all 492 players who qualified for evaluation. You could browse through it to find your favourite player unless your favourite player is Scott Sabourin.
- To get to the interactive table chick here Special Teams – List