
At the start of the season, fans are full of hope. Regardless how well the team did the previous season, with the exception of Colorado this season, the expectation is that the team will be better.
If the team plays poorly in the first twenty games, well, no worries. The season is young, there is time to improve. The local media will trot out the usual story lines: time remains, improvements could happen, making the playoffs is a possibility, buy a ticket.
If the team is still floundering around thirty games in, even the local media will finally admit that which has been obvious for weeks and weeks, namely that the playoffs are more of a next year thing. Discussions of how deep the upcoming draft class is will soon follow.
As all teams have now played at least 30 games, I thought it would be useful to estimate the playoff chances of each team. First, I’ll describe how the playoff chances were determined.
How it Should be Done
One reason that Stapled To The Bench was created was to see what a regular person (me) could do with free data and free software. I admit that the online sites that predict playoff chances do a better job than me. If I had a usable programming language, I would use a much better method to estimate playoff chances, and I would make no such concession to those online sites.
The best method is to “play the rest of the season” a large number of times and calculate how often each team actually makes the playoffs. Your “game playing” method must have a home team advantage (as that is a real thing), it must generate reasonable game scores including overtime and shootouts, and it must simulate the impact of players getting injured.
It is very important part to properly handle the possibility of injuries to good players. Injuries to better players reduce their teams’ abilities to win, which in turn reduces their chances of making the playoffs, which in turn increase the chances of less powerful teams. Provided those less powerful teams don’t lose a good player to a random injury.
Doing What Can be Done with Free Data and Software
I’m using Excel (free software) right now. The free data I have is the results of all games played from 2007/2008 to 2021/2022. As I’m trying to determine the playoff chances for teams in an 82-game schedule, I only used data from 82-game seasons.
Rather than determine what the chances are that a team will make the playoffs this specific season, I will determine the chances a team will get the standing points that would normally be associated with a playoff team. While that is a big difference from simulating the season, and it is a lesser approach, it is free.
The game result data lets me calculate each team’s record game by game through the season. For example, in the 2016/2017 season St. Louis lost their 30th game (6-3 at Nashville). This brought their season record to 16-10-4 (36 points), and they finished the season 46-29-7 (99 points). A team that had 36 points after 30 games finished the season with 99 points.
After 30 games in the seasons being studied, teams had between 14 and 52 points. For each point value, I counted the number of times a team had that number of points, and the number of times their season ended with 90 points or less, with 91 to 94 points, or with 95 or more points.
The 2016/2017 St. Louis Blues were one of fifteen teams that had 36 points after 30 games. One of those teams ended up with 90 or fewer points, one had 91 to 94 points, and thirteen had 95 or more points. Teams that had 36 points after 30 games were 13-1-1 in making the playoffs. The 36-point result is high compared to neighbouring points (it stands out on the following chart). 35-point teams were 14-12-4, 37-point teams were 9-4-5.
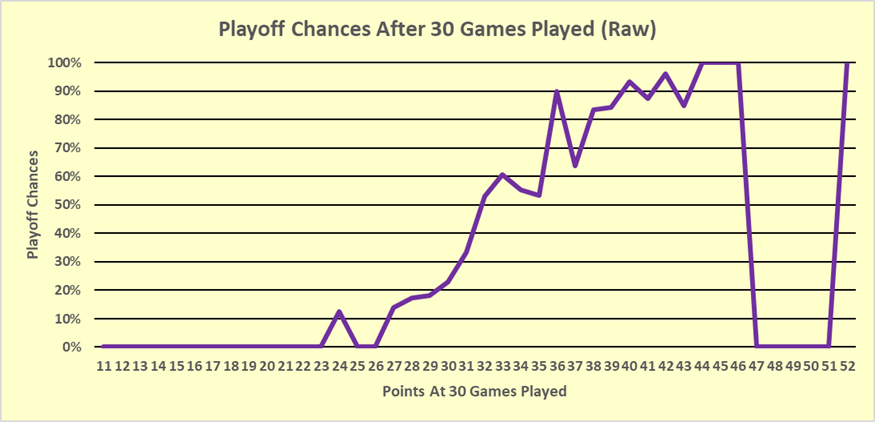
I am a huge proponent of respecting what the data tells us, but not when what it tells us is inconsistent. A significant reason for the inconsistency is a lack of data: I’m only using data from the last twelve 82-game seasons. The trench from 47 to 51 points happened because no teams had 47 to 51 points at the 30-game mark in the period being used. To smooth out the results, I combined data from neighbouring point-values. At this point, I figure enough math has been thrown at you and won’t go more into the details. If you want specific details, ask and ye shall receive.
In the following table, the results of the weighted average calculations are shown in black. A little data-sculpting was necessary, the results of which are the red line.
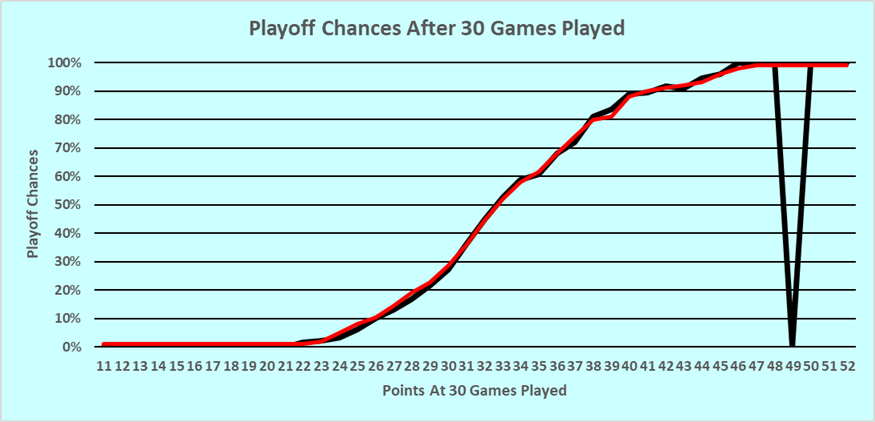
There is a small dip in the black line at 49 points, again because no teams had between 47 and 51 points after 30 games. The red line shows the logical results for the 49-point mark.
At the 30-game mark, no team should be considered 100% sure to make the playoffs, not even Boston, and no team should be considered 100% sure to miss the playoffs, not even Anaheim. Where the actual data had point-values at 100% or 0%, I changed those to 99% and 1%. A final part of sculpting was “sanding”, where I smoothed out some sharp transitions. The biggest change made to any one point-value’s playoff chances was 2%. Except for the 49-point value, of course, where I made a 99% adjustment.
When the 36-point value is combined with its neighbours, and when the sanding is completed, a team with 36 points after 30 games has a 68% chance of making the playoffs. A 35-point team has a lower chance, and a 37-point team has a better chance.
This season, Minnesota has 36 points after 30 games (17-11-2), so they have a 68% chance of making the playoffs. St. Louis, at 14-15-1, has a 29% chance.
2022/2023 Outlook After 30 Games
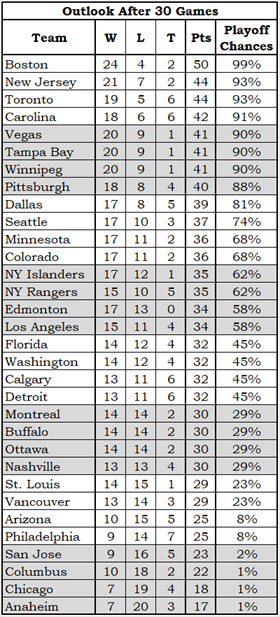
Team records at the 30-game mark were found on QuantHockey.com, where it is possible to get the league standings at a certain date.
If you think your favourite team is more likely to make the playoffs than shown in the table, all I can say is there are still 52 games to play and anything could happen.
For a team that has a small chance of making the playoffs, such as St. Louis, fans will focus on the good things that could result in the team making the playoffs. The team could go on a hot streak. Underperforming players could improve, the goalies could get hot, the power-play could start scoring in droves.
For a team that has a good chance of making the playoffs, such as Dallas, fans will also focus on the good things that will let them maintain their grasp on the playoffs. They will not think their team will go on a losing streak, a couple of hot players will go ice cold, injuries could hobble the team, and/or the team’s penalty kill will fall apart.
“Anything could happen” in the last 52 games of a season, but “anything” means “anything”, not “only good things”.
Summary
As mentioned at the outset, this method of determining the chances of making the playoffs is not as good as simulating the remaining games in a season. The big difference is that the simulation takes into consideration the other teams in a division, while this method just looks at final points.
On December 19th, this method had Dallas at 81% to make the playoffs, while hockey-reference.com had them at 98%. Hockey-reference.com bases their predictions on 1,000 simulations of the remainder of the season, and it is a better way to predict a team’s playoff chances. The hockey-reference.com method is battle-proven, as they won the Stat Geek Smackdown in both 2007 and 2008.