There is the way a team plays, and the results a team gets. Some teams play well but don’t get good results; others play okay but get very good results.
In this article, I will look at six teams whose 2023-24 results were the most different from their level of play. To gain insight into why a team’s results don’t match its play, I will look at player-level data.
While some of the analysis will look like a criticism of players, I prefer to consider them accurate descriptions. I don’t criticize a goalie because he gives up more goals than is expected; I just recognize that fact.
Play and Results
Play and results will be measured using the Hockey Pythagoras Estimate (HPE), which converts goals scored and conceded to standing points. See the article Hockey Pythagoras Estimate for more details.
Goal-HPE (g.HPE) will be used to measure a team’s results. I could easily have used their actual standing points but felt that using g.HPE was more fair, as I can only use HPE for expected goals.
Expected-Goal-HPE (x.HPE) will be used to measure a team’s play. Expected goal data is a measure of the quantity and quality of shots taken and conceded by a team.
Over the league for the 2023-24 season, expected goal totals are very close to goal totals: 8,129.9 expected goals, and 8,086 actual goals. This shows that expected goals are an excellent approximation of actual goals (99.5% accurate). If expected goal values were wrong at the shot level, then the grand totals at the end of a season would be considerably different.
2023-24 Team Results
The six teams below were selected because of the difference between their g.HPE and x.PHE were the widest in the 2023-24 season. The table below shows the standing data for those six teams.
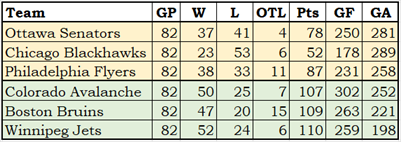
The top three teams (in rows shaded in light orange colour) had the worst results in the league with respect to their play. The bottom three teams (in rows shaded in a green-grey colour) had the best results with respect to their play.
With respect to their actual goals scored, these teams all faired about as well as they should have. They were all within seven points of their g.HPE.

The difference between points and g.HPE is four points or less more than two-thirds of the time. With these six teams, the differences are (top to bottom) 2, 1, 7, 0, 2, 5. Two-thirds of these six teams were within two points. Philadelphia was the beneficiary of some puck luck.
All six teams had season results that reasonably respected their goal data. Remember, these teams were selected because their results didn’t respect their play, not that their results didn’t match the goals they scored and allowed.
2023-24 Team Play
As mentioned earlier, team play is measured by expected goals. The following table shows the data that led to these six teams being selected.

xGF and xGA show expected goal data, while ∆GF and ∆GA (∆ is the Greek letter delta, and delta means ‘difference’ here) show the difference between goals and expected goals.
At the 82-game season level, the difference between a team’s GF and xGF is largely a reflection of the finishing skills of the team’s skaters. A negative difference indicates they “didn’t score as often as they should have,” while a positive difference indicates they “scored more often than they should have.”
The difference between a team’s GA and xGA is largely a reflection of the team’s goaltending. A negative difference indicates their goalies “gave up more goals than they should have,” while a positive difference indicates they “gave up fewer goals than they should have.”
This next table shows each team’s g.HPE, x.HPE and ∆HPE, which is the difference between g.HPE and x.HPE. It is the ∆HPE column that was used to select the six teams.
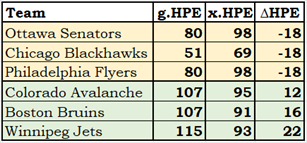
Wait … what? Ottawa and Philadelphia had a higher x.HPE than Colorado, Boston and Winnipeg? Does that mean they played better than those three good teams?
Buttressed by the facts, I say yes they did play better. As a fan of the Senators, I can confirm that they normally play better than their opponents. At the end of many games, you just sit there and say, “How did they manage to lose that one?”
It is time to switch to player-level facts, starting with the skaters. The player-level expected goal data actually tells us how a team managed to lose more games than they should have, based on their play.
NaturalStatTrick.com has individual expected goal data (ixG) for each skater. For each team, I will list all skaters with the best and worst finishing skills. The “Finish” statistic is the difference between iG and ixG, and the tables will show all players whose Finish was above +4.0 or below -4.0.
2023-24 – Skaters, Finish, Context Therefor
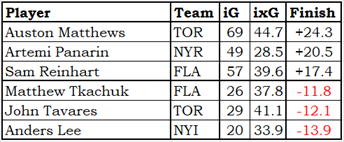
These are the six players whose goal results (iG) are furthest from their expected goal counts (ixG): the top three are exceptional shooters, and the last three are wayward shooters.
It is purely a coincidence that two teams have one each of the best and the worst shooters. Statistics don’t “balance out” this way, and the shooting skills of one player don’t influence the shooting skills of another player.
In 2023-24, 171 skaters had a Finish 4.0 or more away from net zero. 80 of them had positive differences (Matthews was one of those), and 91 had negative differences (Lee). The positive differences were bigger in volume: eighteen players were +10.0 or better, and seven players were -10.0 or worse.
2023-24 – Ottawa Skaters
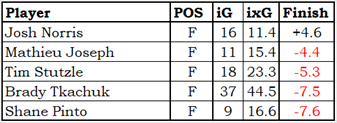
Stutzle was battling an injury last season.
Tkachuk has never done well in this measurement. Since 2020 his “Finish” score is -35.5.
2023-24 – Chicago Skaters

It is interesting that the player who was furthest from expectation for Chicago is Taylor Raddysh, a player who isn’t expected to score much.
Raddysh had a slightly higher ixG than Jason Dickinson and scored 17 fewer goals.
2023-24 – Philadelphia Flyer
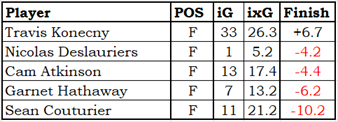
Not much in the way of goal has ever been expected from Deslauriers. He generated a handful of chances last season but only scored a handful of goals.
Couturier should have had five fewer goals than Konecny, not 22 fewer.
2023-24 – Colorado Avalanche
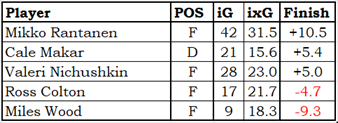
Cale Makar is the only defenseman on these six teams to have a Finish at least 4.0 away from zero. It’s hard for defensemen to have a large number for Finish, as their shots tend not to generate a lot of ixG.
2023-24 – Boston Bruins

Do you think that Boston’s coach, at some point in the season, asked van Riemsdyk to pass the puck more often and shoot less? He has been in the declining stage of his career for two or three seasons now.
2023-24 – Winnipeg Jets

Connor and Ehlers provided Winnipeg with more offense than expected, but they were largely balanced out by Iafallo and Lowry.
2023-24 – Goalies, Context Therefor
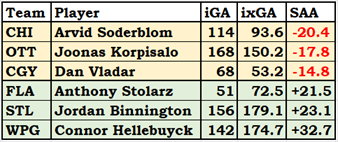
There forwards are evaluated based on their Finishing abilities, goalies are evaluated on their Saving abilities. SAA stands for Saves Above Average; its formula is ixGA-iGA. Having a negative SAA means the goalie gives up more goals than expected.
The table above shows the six goalies whose SAA values are the most extreme, the three best (at the bottom) and the three goalies whose performances left the most to be desired (at the top). I was going to say the “three worst”, but that smacks a little too much of criticism.
2023-24 – Goalies From the Six Selected Teams
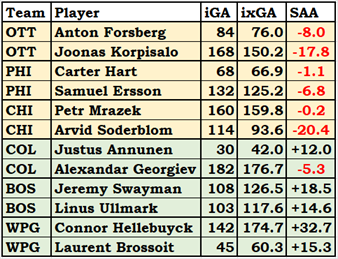
Ottawa’s goalie combo gave up 25.8 more goals than expected. How much did that hurt the team? HPE can provide an answer!
If Ottawa’s goal record was 250-255 (instead of 250-281), Ottawa would have had a g.HPE of 89 points. Their actual g.HPE was 80 points, and they actually had 78 points. Ottawa’s goalie play cost the Senators somewhere between 9 and 11 points.
How much did Winnipeg’s goalie combo help the Jets? They reduced Winnipeg’s goals against by 48 goals, which was worth about 20 standing points. Winnipeg’s tandem was better than Boston’s, and Swayman and Ullmark were really good.
Summary
When comparing season-level goals to expected goals, one must keep in the back of one’s mind that all teams have a difference between expected goals and actual goals. Only two teams were within ten goals: Carolina (277-211; 278.6-212.2; 2.8 difference) and the New York Islanders (245-258; 246.3-265.1; 8.3). Toronto’s difference was closest to the league average (298-261; 275.8-252.1; 31.2).
Player-level expected goal data explains why a team played well but got bad results or played adequately but got good results.
A team blessed with skaters with good finishing skills, such as Colorado, will score more goals than expected. A team with skaters from the Gang That Couldn’t Shoot Straight (Ottawa, unfortunately) will score fewer goals than expected.
Goaltending skills, and not defensive play, account for the team-level difference between goals against and expected goals against. Teams with good goaltending concede fewer goals than expected; teams with weak goaltending give up more goals than expected. At the team level and ignoring goalies, Ottawa and Winnipeg were essentially equal defensively. Their xGA counts were within one goal. Their goals against were massively different at 83 goals, and that was caused by one team having the best goaltending in the league while the other team had the 32nd-best goaltending.

Related Articles.
