
Comparing expected goals to actual goals is nothing new. Other sites do it (hockeyanalysis.com and evolving-hockey.com, for two). At Stapled to the Bench, the comparative statistics are called WRTxGA and WRTxGF, where WRTx stands for “with respect to expected goals.”
WRTxG data measures goalkeeping and finishing (scoring touch). By the way, I first noticed the phrase “finishing” on evolving-hockey.com, so my thanks to that site for providing the exact adjective I wanted.
In this article, I will look at the interplay between actual goals and expected goals at the team level. A related article will look at WRTxG data at the player level.
Is Expected Goal Data Perfect?
I will use expected goal data from NaturalStatTrick.com, my usual data source, even though that data isn’t “perfect.”
Since 2007 there have been 114,966 goals and the total expected goals is 111,222. That makes expected goal data 97% accurate (111222/114966). Expected goal values at the shot level must be slightly pessimistic. As a result, more teams and players have positive than negative WRTxGF data, and more negative than positive WRTxGA data.
WRTxG Calculations
The table below shows two examples of WRTxG calculations.
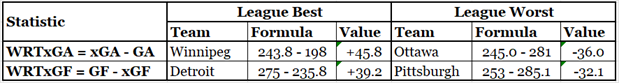
The formulas are arranged so that a positive value reflects good performance: scoring more goals than expected is positive, and giving up fewer goals than expected is positive.
Goalkeeping and Finishing
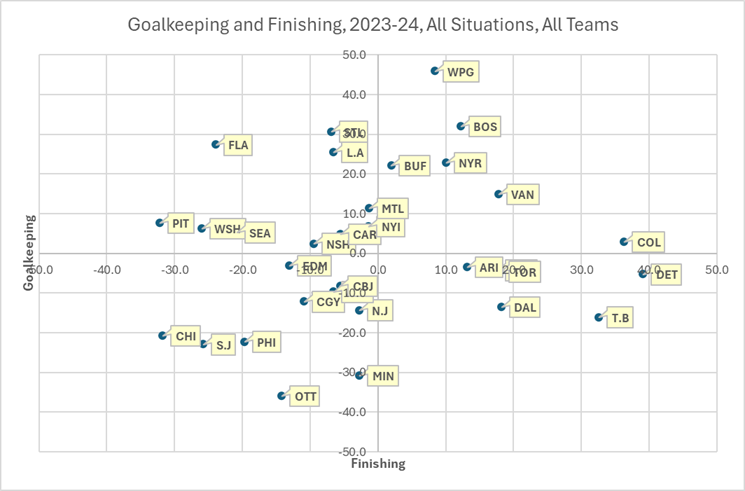
(Chart #1)
In the chart above, teams with better goalkeeping will be at the top of the chart, and teams with better finishing (scoring touch) will be to the right of the chart.
The next sections will look at selected groups of teams.
Is Goalkeeping and Finishing Related to Making the Playoffs?
Yes and no, the chart below shows the 2023-24 playoff teams.
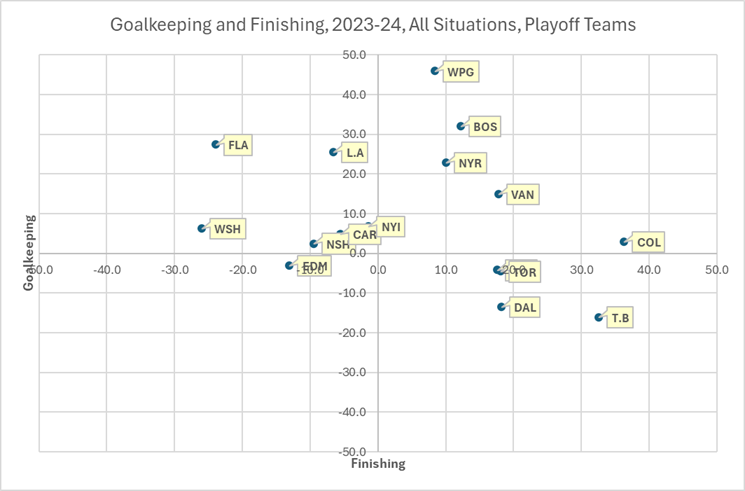
(Chart #2)
Buffalo and St. Louis had good goalkeeping, as they were in the top part of Chart #1, but they didn’t make the playoffs. Five playoff teams, including a Stanley Cup finalist, had negative WRTxGA values: their goalies gave up more goals than expected.
Detroit led the league in finishing but didn’t make the playoffs.
Edmonton’s placement is the most interesting, as they are in the double-negative quadrant of the chart: the Oiler’s goalkeeping gave up more goals than expected and the skaters scored fewer goals than expected (WRTxGF = -13.0). A team with McDavid, Draisaitl and Hyman scored below expectation? Yes.
The Oilers were expected to score 305.0 goals, making them the most offensive team in the league (not Ryan-Reaves-offensive: goal-scoring-offensive). Their scoring doesn’t come from the finishing touch of their players but from their positional play. Tampa Bay scored four fewer goals than Edmonton (288 to 292) and their offence came from finishing, as their expected goals for was 255.4 (WRTxGF = +32.6).
Highest Scoring Teams
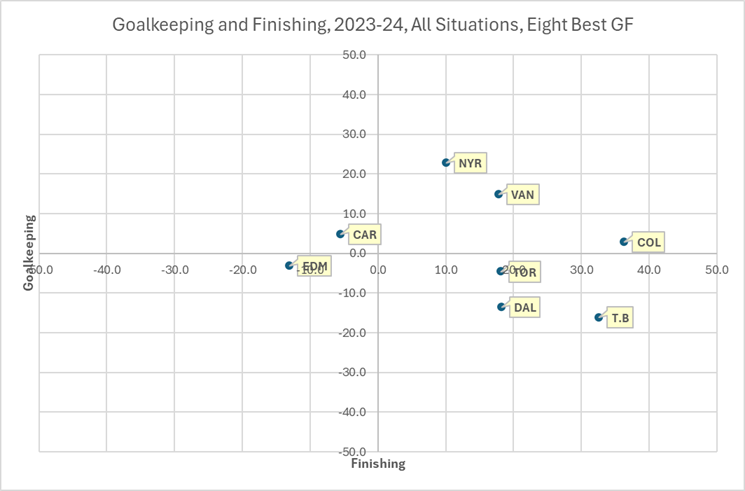
(Chart #3)
Now I want to look at the highest scoring teams. Did they score a lot because they had players who could finish, or did they score a lot because they converted the chances they created? Did they score more than expected or as much as expected?
Many of the teams that led the league in scoring did so thanks, in some part, to the finishing touch of their players. Colorado scored 302 goals in 2023-24, 36.4 more than expected. Tampa Bay also scored more than 30 more goals than expected.
Carolina and Edmonton scored fewer goals than expected. That’s because their players generated lots of scoring opportunities (they had high values for expected goals for). Carolina and Edmonton get their offense from play rather than good finishing.
Best Defensive Teams
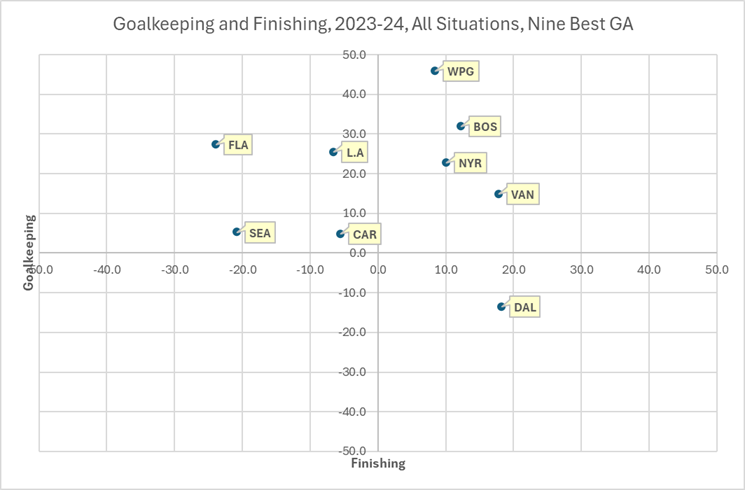
(Chart #4)
I used nine teams because Dallas and Seattle tied for eighth place in goals against. Five of the nine teams gave up at least 20 fewer goals than expected.
Two teams (Seattle and Carolina) got almost no help from their goalies in reducing goals against. One team (Dallas) got hurt by their goalies, who gave up 13.5 more goals than expected. These three teams are at the top of the league defensively because of their team defense.
Is Team-Level WRTxG Consistent from Season to Season?
Let’s let the Los Angeles Kings answer this question, in the form of a line chart that tracks their Goalkeeping and Finishing since 2007-08.
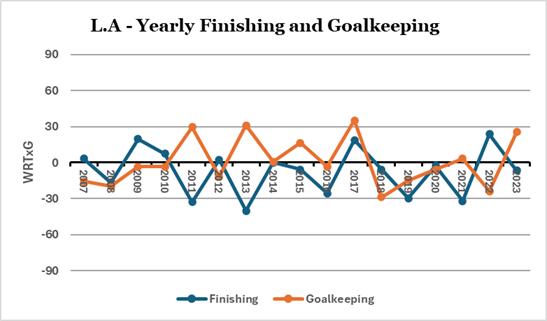
(Chart #5)
How could a team be consistently positive (or negative) in either Finishing or Goalkeeping? What strategies and tactics can a team use that would increase their scoring above expectation or decrease their goals against with respect to expectation? A team could employ strategies that increase expected goals, but I cannot think of a strategy that would increase “finishing”.
Not all teams have a chart that seems to have been populated with random numbers, as seemed to be the case for Los Angeles.
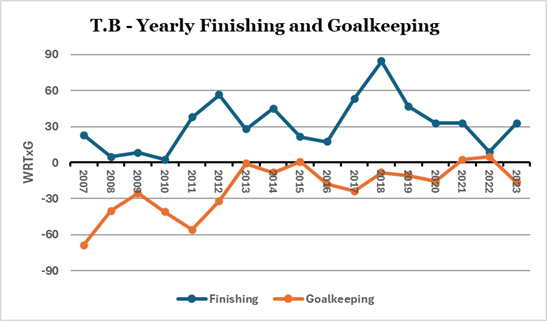
(Chart #6)
Tampa Bay has consistently been positive in Finishing, the result of the team strategy to retain the services of Steven Stamkos. (That line was written before I did the player-level study of WRTxG, but I expect Stamkos will have a positive WRTxGF). Notice how the blue line (WRTxGF, Finishing) went down these last few seasons? Here’s one last chart to consider.
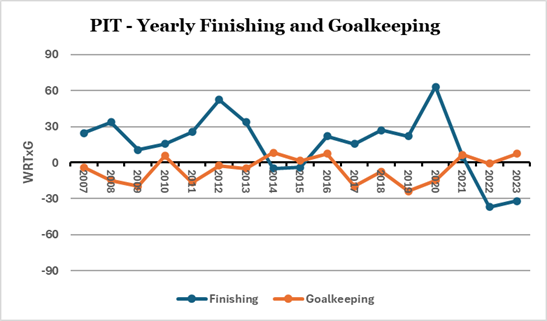
(Chart #7)
Pittsburgh’s data seems to reflect what could be expected of a team that has retained exceptional goal scorers (Crosby, Malkin) who have had the temerity to age.
Where teams have good Finishing data for several seasons, I expect that would be because they have one or more players who are good Finishers.
Goalkeeping data bounces all over the place for most teams because: goalie play tends to be inconsistent from season to season, and goalies get injured so teams sometimes have to play lesser talents.
Summary
Looking at Goalkeeping and Finishing at the team level is somewhat disingenuous (a $3 word for “misleading”). By looking at the team level, there is a slight implication that teams could have strategies that improve Goalkeeping or Finishing.
I think the only team strategy that comes into play in this area is the one where teams retain the services of players who are good at Goalkeeping or Finishing.
For example, Colorado has no strategies or tactics that would help Nathan MacKinnon increase his Finishing (+16.2; 51 goals; 34.8 expected goals). Colorado’s strategy is to retain the services of MacKinnon as long as possible.
The data shows that good finishing will increase a team’s goals for, and good Goalkeeping will reduce a team’s goals against, and those are both good things that will drive a team up the standings.
Related Articles
Players and Expected Goals – Creating
Players and Expected Goals – Finishing