Being a fan of Ottawa, I was wondering the other day about who were the best players to ever play for the Senators. Being a sports data wonk, I wanted to use numbers, rather than opinions, to answer the question (PR-Score, GxPts: see the first two related articles).
There are four Best Player articles, one for each NHL division. The first part of each article, from here to the divisional Best Players tables, will be identical in each article. The Best Players tables will be presented without extra commentary, but the Summary section may have a little something extra.
Methodology
What did I mean by the best player? I was interested in individual seasons rather than a span of seasons. At the start, I wanted to know which player had the best single season for Ottawa. I could do this very easily using PR-Score: the answer for the Senators is Erik Karlsson in his 2015 season, and it isn’t close.
I immediately wanted to complicate my life. What about the best forward? Wait, how about the three best forwards, two best defensemen and a goalie?
For Edmonton, the top three seasons for forwards come from the legal team of McDavid, McDavid and McDavid. I wanted to see three different forwards. This made the data structure a little more complicated, but it was nothing I couldn’t handle.
By the way, any player who was traded mid-season had absolutely no chance of qualifying as one of the best three players for either of the teams he played for.
As I’m using PR-Score for skaters, and GxPts for Goalies, I can only go as far back as the 2007-08 season (with apologies to Wayne Gretzky and Guy LaFleur).
In the next section, I will explain the “Best Players table”.
Description of the Best Players Table
The example Best Players table shown below is Pittsburgh’s “second team”: their fourth to sixth-best forwards, their third and four-best defensemen and their second-best goalie.

The top five data lines are show forwards (yellow shading) and defensemen (green shading). The sixth data line is for a goalie (blue shading). While goalies have the same number of data columns as forwards, the data in those columns are different.
For the skaters, I show four NHL statistics: time on ice (minutes) per game played, goals, assists and points. For seasons that played fewer than 82 games (2012, 2019 and 2020) I show extrapolated data, as that puts all player data on the same scale.
“Lg Rank” is league rank: if the players were sorted by Productivity Rating from best to worst, Jake Guentzel’s 2018 season would be the 248th best season amongst the forwards.
Unit Score is the total Productivity Score of the three forwards or two defensemen, while Unit Rank is the rank (1 would be best) of those productivity scores. Pittsburgh’s second-best set of forwards had a total PR-Score of 26.4, which would place them 45th, while the defensemen have a total PR-Score of 17.4 placing them 50th. In the actual tables, the Unit Ranks will range from 1 to 32. I’m showing the second-best group from Pittsburgh, and there are 64 best and second-best groups in the league.
Goalie data shows games played, total time on ice, goals against (GA) and expected goals against (xGA). SvAA60 is the amount of saves a goalie made above average per 60 minutes of play. Jarry gave up 6 goals fewer than an average goalie would have (138 GA, 144 xGA), and that worked out to 0.10 saves above average per 60 minutes.
GxPts is the rating system for goalies, representing the number of standing points a team should expect with a goalie in nets, playing the amount of time a goalie played. Unit Rank shows how a goalie ranks among the other best goalies. It will range from 1 to 32 when considering the best goalies for each team – Jarry ranks 51st among the top 64 goalies.
Teams will be presented from least impressive to most impressive, based on a formula I cannot describe well as I barely understand it myself.
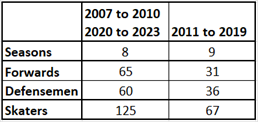
One thing I noticed while compiling the data for this article is the lopsided seasonal distribution of the best players. An unexpectedly large number of them come from either the first four seasons (2007 through 2010) or the last four seasons (2020 to 2023).

The 2011 to 2019 group should have had 100 skaters instead of 67 skaters. I can think of no statistical or methodological reason for this to have happened.
Pacific Division – Best Players Tables


Summary
Seattle and Vegas rank as lowest in this division because they haven’t played that many seasons.
I was happy to see that one of Johnny Gaudreau’s seasons was included for Calgary.

While it felt like his last two seasons were substandard, they actually weren’t. It’s just that they followed his 2021 season and preceded his move to Columbus. His 2022 season rates are very similar to his 2015 and 2017 seasons, while his 2023 season rates similar to his 2019 and 2020 seasons. He wasn’t quite a VR-Star player, but he was a solid VR-First5.
Related Articles
Introduction to Productivity Rating
Teams Best Players – Atlantic Division
Teams Best Players – Central Division
