
Two previous articles (2021/2022 Center Ratings and Top Centers Since 2007/2008) identified the top current centers and the top historic centers (with ‘historic’ meaning since the 2007/2008 season). In this article, I look at the “progression” of centers through their career. At what age do they hit their peak performance? How long do they hold their peak? What is the shape of the slope on each side of the peak?
The question of interest is: are centers ‘born’ or are they ‘made’? Do they make substantial improvements at center as their career progresses?
A Brief Word About #1-Centers
As mentioned in the articles, a #1-Center is a player who: takes a lot of faceoffs; wins a lot of faceoffs; starts shifts in the defensive zone; plays a lot during a game; kills penalties; scores; is “good with the puck”; causes his team to have more shot attempts than shot attempts against his team, and; is a good player (has a good PR-Score). See the article Introduction to Productivity Rating for more information on PR-Score.
#2- and #3-Centers are centers, obviously, but do less of the heavy work than #1-Centers. Some of them may do one or two of the job requirements at the top level, but a #1-Center does almost all of them at the top level.
The Progression of Centers
It was necessary to do a bunch of calculations: good thing I like me some math.
The first calculations focused on determining the maximum 6-year-average CR-Score (MaxAveCR) for all centers. To have a six-year-average CR-Score, a player must have qualified as a center for six consecutive seasons. No one-season wonders included!
A further restriction on players was that their MaxAveCR had to be at least 140 (the bottom of the #3-Center category). This reduced the number of centers in the study to 105.
The next calculations determined each player’s seasonal CR-Score Percent of his MaxAveCR. For example, in 2009/2010 Pavel Datsyuk’s MaxAveCr was 240, placing him solidly in the #1-Center category. His CR-Score was 218, which was 91% of his MaxAveCR. The other datum that is important is his age: he was 31 that season.
The following chart shows the average CR-Score Percent by age, provided there were at least 35 players of that age. Pavel’s 91% from the example above contributed to the 31-year-old group in the following chart. The league average for 31-year-olds was 92%, which could be interpreted to mean that a 32-year-old player was 92% of the center he was at his peak.
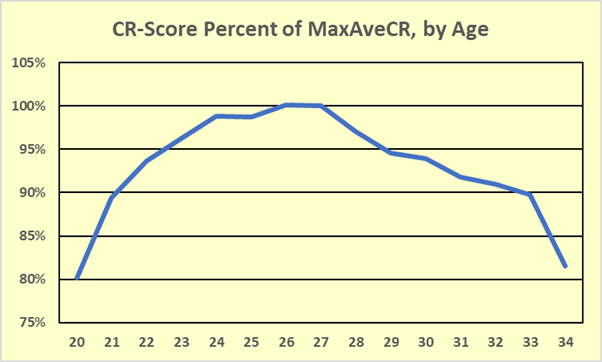
If I’m being honest, this chart was quite a surprise to me. I did not expect to see so much variation from age to age. I was expecting the averages to range between 90% and 100% until players hit their declining years at the ends of their careers.
If a player’s MaxAveCR was that of a #1-Center, it is likely that he’d still be a #1-Center with a CR-Score that was 95% of his MaxAveCR. Looking at the chart, you could say a #1-Center would be a #1-Center from 23 through 33, peaking around 26 or 27.
It must be said that the chart is a little misleading in that it visually overstates the change from year to year. Any chart using percentages should show 0%: the chart below shows the data with a more proper percentage axis.
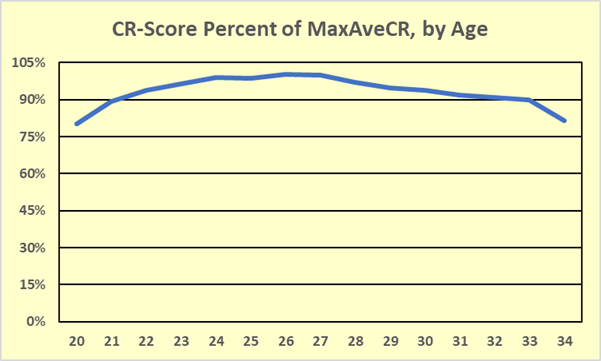
While this second chart is less mis-leading, it is also more mis-leading, because a player will be out of the league long before he’s 50% of the center he used to be, let alone 0%.
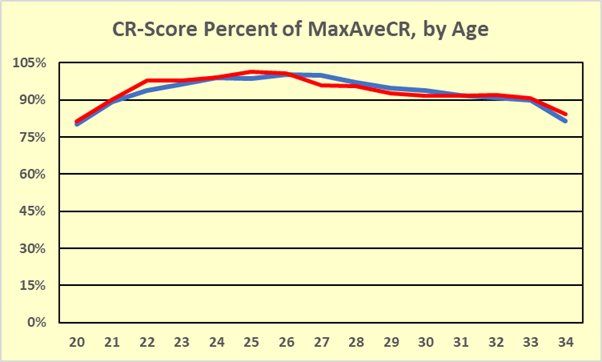
These charts are showing the data for all centers who had a maximum six-year average CR-Score that was at or above 140, which is the bottom of the #3-Center range. I wanted to see how the age progression of the best centers compared with the group at large, so I ran the numbers on centers whose MaxAveCR was 200 or more, which is the bottom of the #1-Center range. The #1-Center line is in red in the following chart.
Quoting Leonhard Euler, a famous Swiss mathematician: “Statistically speaking, that’s all kinds of the same thing.” [Not actually a quote from Leonhard Euler]
All centers (blue) and #1-Centers (red) have basically the same peak, the same lead up to their peak, and the same run down from their peak.
These data still have an ability to mislead. misleading in any other way? The CR-Score Percent is calculated for players who rated at center in a season, so if they retired or just stopped qualifying as a center, they don’t contribute to the average. The 30-year-old category has 70 players in it; the 34-year-old category has 42 players. The data has a “survivor” bias to it.
Summary
Harking back to the intro, the main question was whether centers are ‘born’ or ‘made’?
To me, the data indicate that Centers enter the league at close to their maximum level of performance and achieve that maximum level of performance quickly. A player’s skills will deteriorate late in their career due to aging; at the start of a career a player’s skills will improve due to maturing.
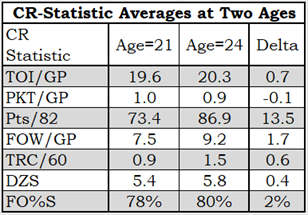
To confirm my opinion I looked at the difference between 21-year-old and a 24-year-old centers, using average data from 18 players who were #1-Centers (according to MaxAveCR) and for whom I had data from both ages.
Data rows are: time-on-ice per game played; penalty-kill-time-on-ice per game played; points per 82 games played; faceoff won per game played; team-relative Corsi per 60 minutes, defensive zone starts per game played and faceoffs-taken percentage).
The only real difference between 21-year-old centers and 24-year-old centers is scoring. The difference in CR-Score between the two groups is 21 (228 to 207); points per 82 games is responsible for 17 of those 21 points.
Centers are born, not made.