
It has been said that the games you win in October are important. A variation of that is that while you can’t win the cup in October, you can lose it. I’ll check out those two adages in this article, using magic (just mathematics, but it can look like magic at times), to determine if the adages are sage advice or fish stories.
Data Sources
The game-by-game records of every season since 2007/2008 for every team comes from hockeydb.com.
Method
I will ignore the shortened seasons (2012, 2019 and 2020), as I want to see the impact of early games in seasons that are 82 games long.
This leaves eleven seasons’ worth of data. I’ll look at team records through each of their first five games, noting what their final points in the standings were.
For example, the 2011 Nashville Predators started that season with a win in game 1, a win in game 2, a loss in game 3, a shootout loss in game 4 and a loss in game 5. They had 2 points after one game, 4 after two and three games, 5 after four games and 5 after five. They finished the season with 104 points.
The number of points it takes to make the playoffs varies from year to year. Teams that get less than 91 points rarely make the playoffs, and teams that get more than 94 points rarely miss the playoffs. For each team start, I’ll count the number of times the team finished with less than 91 p0ints, the number of times the team finished with 91 to 94 points (inclusive) and the number of times the team finished with more than 94 points.
Looking back to the Nashville example, the Predators finished with 104 points, so their count goes in the “more than 97 points” category.
I’ll then approximate the percentage of times that a team which starts with a number of points in a number of games makes it to the playoffs. Teams that ended up with more than 94 points will be considered to have made the playoffs, teams that ended up with less than 91 points will be considered to have missed the playoffs, and the other teams (91 to 94 points, inclusive) will be considered to have made the playoffs half of the time. Below you’ll see the counts for all teams using their final standings, which will provide a little context for the actual tables that are coming up. This is the table I’ll be using throughout the article, so I put dummy information in the first column.
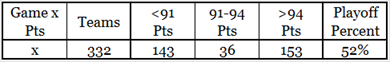
The method estimates 52% of teams will make the playoffs, while in real life 53% of the teams make the playoffs. That’s “close enough” for me.
After One Game
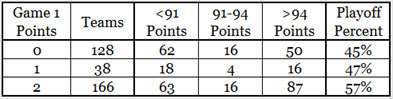
There were 332 first games in the eleven qualifying seasons, resulting in 166 wins, 38 overtime/shootout losses and 128 regulation losses.
Therefore, 166 teams had 2 points after one game, 38 had 1 point and 128 had 0 points.
I was surprised that the expected pattern (fewer points earned, lower chance to make the playoffs) emerged after just one game. It reflects the truth that playoff teams win more games than non-playoff teams, whether it be the first game of the season or the fifty-first.
Toronto just lost their season-opener to Montreal, but I wouldn’t be worried about their chances of making the playoffs. There is another truth that applies: sometimes good teams lose a game to bad teams.
After Two Games
After two games, a team can have anywhere from 0 to 4 points.
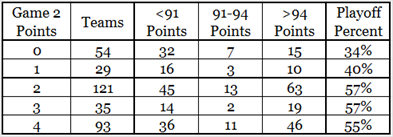
The pattern has intensified. Not getting a win in the first two games is a bad omen.
The pattern isn’t perfect. Teams that started 2-0-0 show as having a slightly lower chance of making the playoffs than teams that started 1-1-0 or 1-0-1. That is caused by a “small-n” situation: there isn’t enough data.
After Three Games
In the following tables, some point totals have been grouped together. That was done because at least one of the individual points being grouped were slightly populated (fewer than 20 teams) and they could be merged with another point (or points) that had similar results. Row shading was added just to make it easier to see a specific row.
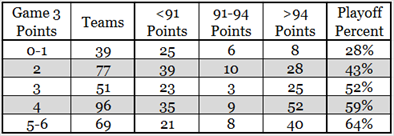
The longer a team has a weak start, the worse the outlook for the playoffs. Similarly, the stronger a team starts out well, the stronger the outlook for the playoffs.
A team with five or six points after three games is more than twice as likely to make the playoffs as a team with zero or one point.
After Four Games
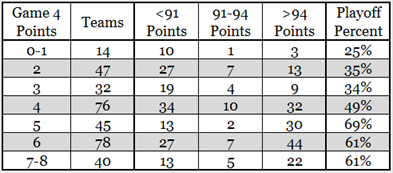
Teams that start the season with 0 to 3 points have a one in three chance of making the playoffs. The 5-point line is a bit higher than you’d expect, and that is 100% a small-n issue. By the 2084 season these data should align properly.
After 5 Games
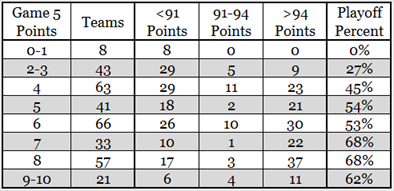
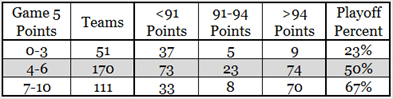
The writing is on the wall (or on the interweb, in this particular instance). The table below is the result of grouping based on playoff percentages.
Summary
The data show that a good start to the season is important.
It might be better to say that a bad start to the season is ominous. In the first five games, the pretenders are separated from the contenders, but the victors aren’t fully separated from the contenders.
Side Bar
A couple of teams have had excellent starts to the season and not made the playoffs. They “throw off” the numbers slightly, by reducing the playoff chances of teams with good starts. Figuratively, they seem like those “once-in-a-century storms” that happen more regularly than once in a century. One team stands out in this regard.
The 2015/2016 Montreal Canadiens started the season 5-0-0, then won their next four games to go 9-0-0. After 26 games, they were 19-4-3 and were on pace for 129 points. In the next 26 games, they went 5-20-1. They ended the season well out of the playoffs at 82 points.
Injuries really nobbled the Canadiens. They lost Carey Price early in the season: he only played twelve games. It has to be noted that Montreal went 19-4-3 and Price played less than half of them: they were 10-2-0 with Price in the nets, 9-2-3 without him.
Then they lost Brendan Gallagher for six weeks. While Gallagher’s exodus fits in very well with the 5-20-1 skid, it does not explain it.
The difference between the best team in the NHL (19-4-3) and the worst team in the NHL (5-20-1) is not Carey Price and a team’s fifth-best player. That is putting way too much value on those two players.
Amongst the players who played at least 50 of the first 52 games for Montreal are: Max Pacioretty, P.K. Subban, Alex Galchenyuk, Andrei Markov and Tomas Plekanec. Pacioretty and Markov were PR-Star players that year, while the other three were PR-First5. Had Gallagher been healthy all season, he would have ranked below all of them except Galchenyuk.
Something on top of the loss of those two players brought Montreal down. I don’t know if I can find what happened with the data I have. I wouldn’t even know what data to look at.