
Ottawa’s playoff run in the 2014/2015 was improbable, to say the least. The lasting impression is that Andrew Hammond carried the team through the last part of the season and dragged the Senators into the playoffs.
I thought that a review of the data would show that several players were responsible. And this article is the result of that data review.
First, let us relive the joy of the run itself. As the run was quite dramatic, let’s look at the games using the structure of a four-act play.
Act 1 – Introducing Key Elements of the Story
From the start of the season, the Senators were playing .500 hockey. As the calendar year changed, Ottawa was 15-14-7. On January 21, Craig Anderson suffered a hand injury in a 4-3 win over Toronto. They were 19-18-9 after the game. It turned out Anderson would be unavailable for months.
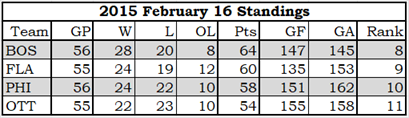
Robin Lehner became the starting goalie. In a game against Carolina on February 16, Lehner was injured in a collision with teammate Clark MacArthur (both players got concussions). Andrew Hammond came in to finish the game, giving up two goals on five shots.
Ottawa lost the game 6-3. Their record was 22-23-10, they were ten points behind Boston (8th place), six behind Florida, and four behind Philadelphia. They had gone 3-5-1 since Anderson’s injury.
After two more games at home, they were to embark on a five-game road trip that included the dreaded West Coast swing.
Boston was on pace to get 94 points, while Ottawa was on pace to get 81 points. To make the playoffs Ottawa would likely need at least 94 points, meaning they’d have to get a record of something like 18-5-4 in their last 27 games.
18-5-4? With a backup to the backup in nets? Without MacArthur, Phillips and Neil? Optimism about the season outcome was not just hard to find, it did not exist.
Act II – Events Leading up to Key Events
Ottawa beat Montreal and Florida at home. They started their road trip with the West Coast swing, winning all three, with back-to-back shutouts in Anaheim and Los Angeles. After a shoot-out loss in Minnesota, they won in Winnipeg and headed home.
They were 6-0-1 in their last seven games. Ottawa had gained ground on the teams in front of them, but still had to pass three teams to make the playoffs.
Ottawa came home to a three-game home stand. They beat Buffalo, but who didn’t? A shootout win over Calgary was followed by a 3-1 loss to Boston, the team they really needed to beat.
Two away wins followed, over Montreal and the Islanders. Then came a home shoot-out victory over Philadelphia, and a road overtime victory against Carolina.
In the last seven games, they had moved past Philadelphia and Florida. The Flyers were pretty much out of the picture, ten points adrift of the last wild card team with only ten games to play and with two other teams ahead of them. Ottawa was four points behind the Bruins and three points ahead of Florida, and Ottawa had a game in hand on them both.
Act III – The Real Struggle Begins
Ottawa continued their torrid streak by winning their next three games, all at home. They beat the Bruins 6-4, a crucial win against the team they were chasing. While celebrating on the ice after the game, Curtis Lazar ate a hamburger that a fan had thrown on the ice, simultaneously joyous and disgusting. They then beat the Leafs and the Sharks.
In the last seventeen games, Ottawa had gone 15-1-1.
And then they cooled off. The lost to the Rangers 5-1, lost in overtime against Toronto, and lost against Florida at home.
All streaks come to an end, and it felt like Ottawa’s glorious hot streak had turned ice cold. Although Philadelphia was no longer a concern, Boston was still three points ahead, and Florida was now just one point behind Ottawa. The three of them were in a fight for one playoff spot. Ottawa had seven games remaining, while Boston and Florida had six games remaining.
Act IV – A Renewed Sense of Purpose Inspires the Protagonists
In the next few days, Florida bowed out of the race for 8th. That left Boston, who was ahead by three points but had one fewer game to play.
Boston and Ottawa’s final games are shown in the table below.
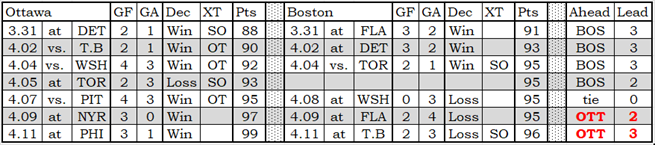
The first three columns for each team show the date of their game, whether they were at the other team’s arena (at) or playing at home (vs.), and the opponent. Then comes the score, the decision and the XT column shows whether the game was decided in overtime (OT), a shootout (SO) or regulation (blank). Pts is the standing points a team had after the game.
The last two columns show which team is ahead, and by how much.
Ottawa won their first three games (all in overtime) but so did Boston: Ottawa gained no ground.
Ottawa’s April 5th game was their game-in-hand on Boston. It was a chance to make up significant ground, but they lost, as Ottawa never seems to be able to beat Toronto in an important game. The bright side was that the game was an overtime game. Ottawa got the bonus point, reducing Boston’s lead to 2 points.
On April 7th, Ottawa hosted Pittsburgh and won. The next day, Boston went to Washington and got shutout. They were tied for the final playoff spot with two games to go in the season.
On April 9th, Ottawa travelled to New York and beat the Rangers, who were in first place in the Eastern Conference. Boston travelled to Florida and lost. This gave Ottawa control of the final playoff spot. If they won or tied in regulation, they would get into the playoffs. If Boston lost in regulation or in overtime, Ottawa would get into the playoffs.
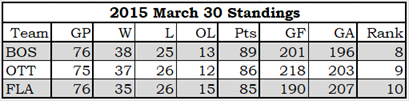
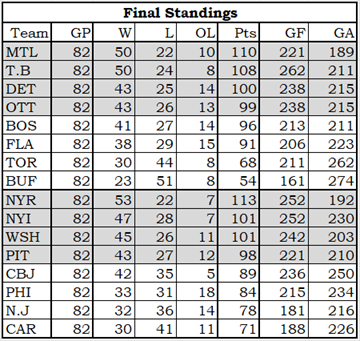
On April 11th, both things happened: Ottawa won, Boston lost in overtime. The final standings are below, with playoff teams in the shaded rows.
Ottawa finished the season on a 21-2-4 run. Just how much credit does Andrew Hammond deserve for this result?
To find this answer, I first looked at data at the team level.
Team Play – Special Teams
Ottawa’s power play was slightly less effective in the second segment: 92% as effective as in the first segment, as I calculate things. Ottawa’s penalty kill improved dramatically: 140% as effective as the first segment. In the first segment, they gave up 0.62 goals per game when shorthanded; that dropped to 0.37 in the second segment.
Looking at power-play and penalty-kill time in the two segments, Ottawa was down 76% in both in the second segment. It was almost certainly caused by the referees not calling penalties that were called in the first segment.
What fan doesn’t say “That was a penalty at the start of the season” towards the end of the season and in the playoffs? A doubter might say that the reason penalties went down could be caused by players having changed the way they play. If you are facing trial by jury, you want doubters in the jury.
A realist would accept that it is far more likely that a couple of dozen referees changed their definition of penalty instead of 900 players changing the way they play. A realist would point out the decrease in penalties across the league in the second segment.
Team Play – Shots On Net
Some of the goalie statistics can be used to see if the team was playing differently with different goalies in the net. Anderson, Lehner and Hammond appeared in 35, 25 and 24 games respectively.
Anderson faced 32.5 shots per game, Lehner 31.8 and Hammond 30.1. It would seem that Ottawa was a little tighter defensively when Hammond was in the net, giving up two fewer shots per game.
Team Play – Faceoff Location
In the first segment, Ottawa had 34% of their faceoffs in the offensive zone, 34% in the defensive zone, and 32% in the neutral zone (34% – 32% – 34%). In the second segment, it went 37% – 32% – 31%. In practical terms, that meant Ottawa had two more offensive zone faceoffs and two fewer defensive zone faceoffs per game in the second segment. It is proof that they were playing better as a team.
Team Play – Corsi
Corsi measures shot attempts, and it’s best to talk about team-level Corsi while playing at 5v5. In the second segment, Ottawa was net 1.6 shot attempts better per game. Their increase in the share of shot attempts is another bit of proof that they were playing better.
Team Play – Blocked Shots
Overall, Ottawa increased their shots blocked by 0.6 per game in the second segment. A few guys were up, a few less were down: no spectacular changes.
Team Play – Hits
Ottawa delivered very slightly fewer hits per 60 minutes in the second segment than in the first. There is no way to twist this fact into a positive for fans who think that hits are vital to winning. The league hit rate went up slightly in the second segment (data from all teams for their last 27 games).
Team Play – Goals For and Goals Against
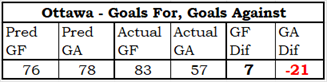
At the pace they were playing through the first segment, Ottawa should have scored 76 goals and conceded 78 goals in the second segment (Pred GF and Pred GA in the table above). They actually scored 83 and conceded 57: 7 more goals for and 21 fewer goals against than expected.
Using a hockey subvariant of the Pythagorean method to estimate standing points (see the Pythagorean Method section at the end of this article), a team that outscores their opponents 83-57 over 27 games should get 41 standing points; that corresponds to a record of 18-4-5. Ottawa actually finished 21-2-4, so they had five more points than they should have based on their scoring data. When this happens, a team has generally won more close games than expected, and hasn’t won many games by wide margins.
Team Play – Goals Scored 5v5
In the first segment in 5v5 play, Ottawa’s score per 60 minutes was 2.34-2.43, a very slight deficit. Over 82 games, that would amount to a deficit of 8 goals.
In the second segment in 5v5 play, Ottawa’s score per 60 minutes was 2.40-1.80, a huge improvement, a massive improvement. This improvement was clearly defensive in nature: they reduced goals against by 0.63 goals per game.
Now it is time to turn our attention to the players. I’ll start with all skaters, then look at some details for the defensemen and goalies, and finally I’ll look at the Hamburglar.
Player Productivity Ratings
It doesn’t look like the Senators made any trades in 2014/2015 of NHL level players. When a player is traded mid-season, the team information on his records in NaturalStatTrick will show both teams: “OTT, VAN” or “BUF, OTT”, for example. (The teams are listed in alphabetic order in NaturalStatTrick). I found no “OTT, team” or “team, OTT” records.
The following table shows how the players played in the first 55 games and in the last 27. Their season data was projected to 82 games for both segments of the season, and then PR-Formula calculated the players’ PR-Scores, which placed them in the PR-Categories.
The table shows every Ottawa player who was ranked PR-Regular or above in either set of games. When a player’s PR-Rating in the last 27 game segment is red, he played better in that segment. If the font is green, his rating was worse.
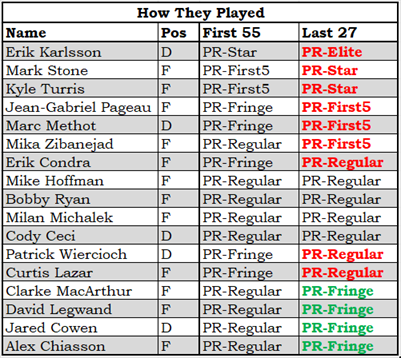
Two players who played in the first segment didn’t play at all in the second segment: both Chris Phillips and Chris Neil had season ending injuries. Both were playing at the PR-Fringe level anyways, so they are not included in this table.
Four players had lower ratings in the second segment. Clarke MacArthur played only nine second-segment games due the concussion. Jared Cowen played only seven games, and that must have been due to an injury. I couldn’t find a specific reference to it in a quick scan of interweb search results, but hockeydb shows that he didn’t play in the minors in 2014/2015. David Legwand’s career was winding down, and the more he played the worse he played. That happens when you get old. Alex Chiasson lost 33% of his ice time in the second segment, which reduced his rating. His lower rating was strongly influenced by his loss of playing time, but I’d say his loss in playing time was strongly influenced by a him not playing as well in the second segment.
Mika Zibanejad’s improvement was somewhat a technicality. He was near the top of PR-Regular in the first 55 games, and just above the bottom of PR-First5 in the last segment. His minor improvement just happened to put him in a different category. Some players who stayed in the same category had bigger changes in PR-Score.
Curtis Lazar improved from PR-Fringe to PR-Regular. Erik Condra and Marc Methot improved from PR-Fringe to PR-First5: both missed games in the first segment. J.G. Pageau only played 23 of the first 55 games but played all 27 games of the run. He improved from (near the top of) PR-Fringe to PR-First5.
Kyle Turris and Mark Stone both improved from PR-First5 to a PR-Star level of play, while Erik Karlsson went from PR-Star to PR-Elite.
The Defensemen – Time-On-Ice
No team goes through a season without having to address player injuries. In the first 55 games, Chris Phillips and Jared Cowen were two of their top six defensemen (in terms of time-on-ice). Phillips didn’t play in the last 27 games, while Cowen played fewer than ten games. What happened to their ice time?
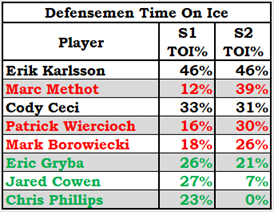
This table shows how much of the time each defenseman was on the ice in the two season segments we are looking at (S1 is the first 55 games, S2 is the last 27 games).
Rows in black font indicate the players had about the same share of the ice-time in both segments. Red font is for players whose ice-time increased, green for those who had less ice-time.
Cowen and Phillips lost a lot of ice-time in the second segment, being injured and very injured. Eric Gryba lost ice-time because he wasn’t playing as well as in the first segment.
Marc Methot got a lot of the missing time, playing every game in the second segment and playing well. Wiercioch got more time, largely for the same reason. It’s probably not literally true, but it looks like Mark Borowiecki was given the time that was taken from Eric Gryba.
In the second segment, the Senators stuck with six defensemen: the top six defensemen had 93% of the ice-time. The top six got 86% of the ice-time in the first segment.
The Defensemen – Penalty Killing
In the first segment, the main penalty-killing defensemen were Ceci, Gryba and Phillips. Cowen and Borowiecki would see some PK time, about two minutes per game on average, while Karlsson was “selectively” used (36 seconds per game).
In the second segment, the PK duties were taken over by Borowiecki, Methot, Ceci and Gryba. Borowiecki went from fifth-most used PK defenseman to most used.
The Defensemen – Scoring
Well, the defenseman-scoring story for Ottawa in both segments was Erik Karlsson. He was on a 63-point pace in the first segment, and that improved to a 73-point pace in the second segment. In real life, that was an increase of about 3 points for Karlsson in the second segment (compared to his first segment pace).
The other defensemen scored like defensemen, one in each segment on a 20-point pace, most of the rest in the teens. Phillips barely scored in the first segment (3 assists).
It is safe to say that Ottawa’s scoring from defensemen didn’t change in the second segment.
The Defensemen – Takeaways, Giveaways
In the second segment, the defense had a small increase in takeaways and a big increase in giveaways.
The giveaway data is confusing. The number of giveaways per 60 minutes almost tripled in the second segment. Karlsson increased his giveaways by 0.7 per 60 minutes; Gryba went up 1.4 per 60 minutes; Borowiecki and Ceci went up 1.5; Wiercioch went up 2.9. These are indications that Ottawa had the puck more often in the second segment, as you have to have the puck to give it up. But Ottawa didn’t have the puck three times as much.
I have no good idea why this stat went up so much (different scorekeepers?). An increase in giveaways is not what you’d expect from a team that was playing significantly better.
The Forwards – Time On Ice
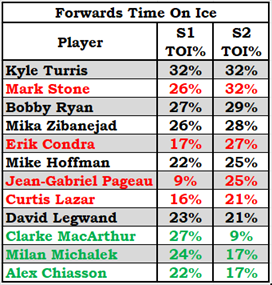
This table has the same structure as the Defensemen Time On Ice table.
Mark Stone played much better in the second segment, and was rewarded with more ice time. Kyle Turris also played better in the second segment, but increasing his ice time could have proved detrimental, as he was already playing a lot.
Lazar played almost every game in the second segment after missing games in the first segment: that accounts for his increase. J.G. Pageau had the same story, but a little more extreme (he missed more games in the first segment).
MacArthur and Michalek had injuries in the second segment, dropping their share of ice time. Chiasson was “used strategically” in the second segment: he went from 15 minutes per game to 10 minutes per game.
The team stuck with twelve forwards in the second segment. The top twelve forwards in the second segment got 95% of the ice time; in the first segment the top twelve got 91%.
The Forwards – Penalty Killing
In the first segment, the main penalty-killing forwards were Legwand, Condra, Michalek, Stone and Chiasson (listed in order of penalty-kill time on ice). In the second segment, the rotation was Condra, Pageau, Legwand, Stone and Michalek. Condra and Pageau were the main PK forwards.
The penalty-killing roles were more concentrated in the second segment: the top five PK forwards in the second segment got 87% of the PK time, while the top five in the first segment got 67% of the PK time.
The Forwards – Scoring
Ottawa forwards weren’t lighting things up in the first segment. A few of them picked up the pace significantly in the second half. The table below shows the scoring pace (points per 82-game season) of selected forwards in both segments. For example, Bobby Ryan played 51 of 55 games in the first segment, with 42 points. That is the equivalent of 76 games played and 63 points per 82-game season.
“S2 Chng” means the change from segment 1 to segment 2 – a positive number indicates the player increased his scoring pace.
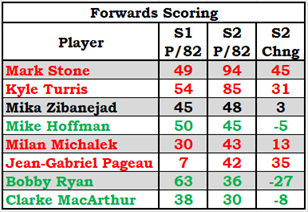
Stone and Turris dramatically increased their scoring in the second segment.
Michalek’s increase was conflicted. He missed many games in the second segment, but scored like a demon when he did play.
Pageau’s increases can be attributed to a slightly better scoring pace and a significantly better attendance pace.
Zibanejad and Hoffman were largely the same in both segments.
MacArthur had the same problems as Michalek: missing many games in the second segment, but scoring very well when he did play.
And that leaves us poor Bobby Ryan, whose scoring pace dropped off a table and hid under the credenza. He is the only forward on the team whose scoring could be criticized in the second segment.
The increased scoring of Stone and Turris were a factor in Ottawa’s improved second-segment play. These two men in particular made a good contribution to the run.
The Forwards – Faceoffs
In the first segment, the four forwards who took the most faceoffs were Turris, Zibanejad, Legwand and Lazar. They took 81% of the first-segment faceoffs, winning them a nifty 48% of them. In the second segment, four forwards took 99% of the faceoffs: Turris, Zibanejad, Pageau and Legwand. Many team roles seem to have been focused on specific players in the second segment.
To those of you who think that faceoff success is critical to a team’s success: it isn’t. If a team is winning around 50% of the faceoffs overall, then faceoffs will not be important to that team’s success. Ottawa went 21-2-4 losing more faceoffs than the won, and they also went 22-23-10 with an almost identical faceoff winning percentage. Faceoff play did not impact their results in either segment.
The Forwards – Takeaways, Giveaways
In the second segment, the forwards as a group had a small increase in takeaways (thanks, Mr. Stone) and a small decrease in giveaways.
The Goalie – Hamburglar
NaturalStatTrick doesn’t have a lot of statistics for goalies. In fact, they have 20, counting the goalie’s name and the team he played for as two statistics. It has traditional goalie stats and a few non-traditional ones. While it doesn’t have many goalie-specific stats, the ones they have show that Hamburglar “stood on his head” in this run.
Hammond’s save percentage (SV%) was 94.1%: Anderson had an SV% of 92.3%, Lehner 90.5%. Saving 2% more shots when facing 707 shots (as Hammond did compared to Anderson) would reduce goals against by 14.
Hammond’s goals against average (GAA) was 1.79: Anderson’s GAA was 2.49, Lehner’s was 3.02. Hammond’s GAA was 0.70 better than Anderson, 1.23 better than Lehner. In the time Hammond played, his GAA meant 16.5 fewer goals against than Anderson would have had, and 29 fewer goals against than Lehner.
NaturalStatTrick has GSAA, which is Goals Saved Above Average. A positive value means the goalie made more saves (prevented more goals) than an average goalie. Andrew Hammond was +12.57 GSAA, Anderson +0.53, Lehner -13.87.
All these numbers indicate that Hammond reduced Ottawa’s goals against by 12 to 16 compared to what Anderson might have done, and by 26 to 29 goals compared to Lehner.
Reducing a team’s goals against by 12 to 16 in a 24-game period is extremely valuable. Using the Pythagorean method (hockey subvariant) that converts goals for and goals against to standing points, that would be worth six standing points. Six points more than if Anderson was playing. Compared to Lehner’s play, Hammond was twelve points better.
Nobody, and I sincerely mean nobody, expected this level of play from Andrew Hammond. It would be hard to expect that level of play from Carey Price. Hammond played about as well as a goalie can realistically play during the run.
Summary – The Hamburglar Run
The first thing I wrote for this article was the title: the brackets were there on purpose. I was sure that the data would show that, while Hammond played well, so did several other players. Ottawa’s run would surely have been due to a group of players playing exceptionally well, rather than just one guy.
I was somewhat correct. No one player is responsible for ten wins in a season by himself, let alone ten wins in 27 games. Erik Karlsson, Mark Stone, Kyle Turris, Jean-Gabriel Pageau and Marc Methot played markedly better in the run.
But, my goodness, Hammond’s numbers.
Hammond, Anderson and Lehner had save percentages (SV%) of 94.1%, 92.3% and 90.5%. Those numbers dramatically understate the difference between the players. 94.1% doesn’t sound all that different from 90.5%: we’d take either one as a final mark in geography or history. Opposition scoring percentage (OS%) does a better job of describing the difference between the three goalies. Hammond, Anderson and Lehner OS% of 5.9%, 7.7% and 9.5%. In every three games (90-ish shots), Hammond would have given up two fewer goals than Anderson, four fewer than Lehner.
If it was just a hot streak for Hammond, it was volcanically hot.
It is appropriate to refer to those 27 games as The Hamburglar Run. Without brackets.
Pythagorean Method to Estimate Standing Points
I was first introduced to the Pythagorean Method by the writings of Bill James. Mr. James wrote yearly reviews of Major League Baseball (The Bill James Baseball Abstract) with a heavy statistical slant, but he used statistics differently than the sportwriters of the day (late 1970s through late 1980s).
Bill James would use statistics to investigate issues, rather than look for statistics to support his point of view. Many sportswriters used statistics they way a drunken man uses a light pole: for support, rather than for illumination. James would shine the light on issues.
Quoting from the 1983 edition of The Bill James Baseball Abstract:
“The Pythagorean Method predicts that the ratio between a team’s wins and losses will be the same as the ratio between the square of their runs and the square of their opponents’ runs.

If a team scores 800 runs and allows 700, their win percentage will be about .566, so they should win about 92 games.
The method has a standard error of about 4.2 wins; we could reduce this slightly be raising runs to a power slightly below 2 (1.82 seems the most accurate), but the gain in accuracy is frankly not worth worrying about.”
A slightly different formula must be used for hockey, as teams that lose in overtime get a bonus point while baseball teams that lose in extra innings get the same loss they would have had if they had lost in nine innings. The best adjustment comes from increasing the points percentage by 11% (1.11 in the formula below).

In 2021/2022, the Boston Bruins scored 172 goals and gave up 144. Plug those numbers into the formula and you get:

In 82 games, a Points Percentage of 0.653 would be equivalent to 103 points. By no coincidence at all (I chose Boston for a reason), Boston had 103 points.
Since 2007/2008, in 82-game seasons, this formula predicts a team’s final standing points within 4 points 68% of the time.
In the last two seasons, the formula hasn’t been as accurate as it was over the previous thirteen seasons. Between 2007/2008 and 2019/2020, the formula was accurate to within four points for 19 to 26 teams a year with one exception (2010/2011, 13 teams). In the last two seasons it was accurate to within four points for 16 teams, then 13 teams. I understand this to be a normal statistical variation. If your score for a round of golf is normally between 85 and 93, you will have scores below 85 (the days you golf “as you should all the time”) and scores above 93 (“the windy days”, “the bad chipping days”, “the couldn’t find the fairway with a map days”).

Not showing my work, that works out to 75.4%, which is 41 points from 27 games.