In this article, I steal an idea from Bill James (author of the annual Baseball Abstract books from the 1980s) about comparing statistics based on their importance.
My pre-analysis expectation is that the most important statistic will be goals (duh), while the most trivial statistic will be hits. I am not sure how other statistics will sort themselves out.
Focusing on Not Focusing
How important is a faceoff? We all have memories of a game where our team won a faceoff in the offensive zone late in a tied game, made a couple of quick passes and scored the game-winning goal. Certainly, that faceoff was important, but a typical game has 60 faceoffs and not all 60 of them happen late in the game, with a tied score, in the offensive zone.
If you focus on important faceoffs, you show Salience Bias, which is the tendency to focus on more prominent or emotionally striking events and ignore unremarkable ones. To avoid Salience Bias, I will look at team-level and season-level statistics. I will evaluate Toronto based on their winning 2,629 of 4,959 faceoffs in 2018, rather than one or two John Tavares late-game faceoff wins.
Measuring The Importance of a Statistic
I will use a similar method to the one Bill James used in an article he wrote about the importance of stolen bases (which are not important, by the way). Using statistics from the last six seasons, I’ll note the teams that had the four best and four worst performances in various statistics in each season, see how many standing points they had, then calculate the difference in points between the two groups.
Let’s look at an example from the Takeaway statistic. The four teams with the highest number of takeaways in 2018 were: the Vegas Golden Knights, Carolina Hurricanes, Calgary Flames and Florida Panthers – between them, they had 3,378 takeaways. The four teams with the lowest number of takeaways were: the Buffalo Sabres, Philadelphia Flyers, Detroit Red Wings and the Los Angeles Kings – between them they had 1,893 takeaways.
The top four teams had 385 points while the bottom four teams had 303 points. That was an 82-point gap or an average gap of 20.5 points.
Doing this for each season from 2018 to 2023, the average standing gap between a league-leading team and a bottom-dwelling team is 11.8 points. This shows why I am using six seasons instead of just 2023-24: the gap in one season was 20.5, but the average gap in the other five seasons was 10.1. One season is too small of a time frame to evaluate statistics.
But before I go into the statistics, I must first tell you about extrapolation.
Extrapolation
The Takeaway gap of 11.8 points is based on an 82-game season, but two of the regular seasons in this time frame, 2019-20 and 2020-21, were shortened due to the pandemic. So that all season-point totals were equal contributors, I extrapolated standing points in those pandemic-cursed seasons.
For example, the Pittsburgh Penguins had a 37-16-3 record in 2020-21, earning 77 points. What is the 82-game equivalent of those 77 points? Extrapolation gives us the answer.
One way of thinking about extrapolation is that it is an act of stretching. If you had an elastic band that was “112 points long” (56 games times 2 points per game), and drew a red line from top to bottom at the 77-point mark, where would the red mark be if the elastic band was stretched to 164 points?
The diagram below shows the stretch. The top row represents the season Pittsburgh played, and the bottom row shows the 82-game equivalency: 113 points.

The Excel formula I used to do this extrapolation was ROUND((82*Pts/GP),0). I used ROUND as I didn’t want to have fractional values for points.
That’s it for extrapolation. Now let’s look at building-block statistics.
Building-block Statistics
Building block statistics that are not direct attempts to score goals. They are actions that are done to put your team in a position to score a goal or in a better position to prevent a goal: faceoff wins, blocked shots, hits, takeaways and giveaways. I used counts for all of the statistics except Faceoff Wins, where I used each team’s percentage of faceoffs won.
Statistics are presented in order of difference between the standing points of the top four and bottom-four teams. The bigger the difference, the more important the statistic.
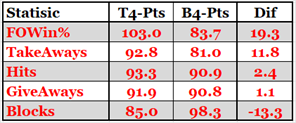
Wait … what? Are giveaways unimportant and blocks bad? Obviously not. What is needed is context, some measure of opportunity. For a team to have a takeaway, the opponents have to have the puck. Given that there are no freely available puck-possession statistics, how can puck-possession be estimated?
For Takeaways, Hits and Blocks I will use a team’s Corsi Against count as a proxy for the puck-possession of the opponents. For Giveaways, I’ll use a team’s Corsi For count.
By way of example, the 2018-19 Colorado Avalanche had 1,324 blocked shots and a Corsi Against of 4,863. They blocked 27% of attempted shots, which led the league that season.
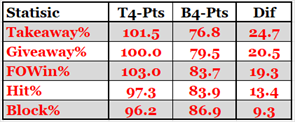
I’m surprised that hitting isn’t in last place in importance. I was so confident hits would be last that I named the article “From Goals to Hits.” If you’ve read many of my articles, you will know that I don’t think much of hitting and I don’t think much of one-dimensional players that deliver hits. I maintain that position and will provide proof for it in the Summary section.
Foundational Statistics
Foundational statistics are those that measure attempts to score Shots (on net), Corsi (all shot attempts) and xGoals (expected goals). Expected goals are based on the quantity and quality of shots a team takes.

I used a team’s difference in the for and against counts. For example, the 2018-19 Ottawa Senators had 4,377 Corsi For and 5,385 Corsi Against for a Corsi Difference of -1,008, putting them in 31st place out of 31 teams. I didn’t use the actual For and Against counts in the table because the difference between them was more important than the individual categories, as shown by the following example using expected goal data.

Cornerstone Statistics
Cornerstone statistics are goals. As with foundational statistics, I’ll be using the difference between for and against counts, for the same reason: the difference between for and against is more important than individual for or against counts.
Here are the results for all goals scored, powerplay goals (PP) and penalty kill goals (PK). As an example, the 2021-22 Montreal Canadiens scored 6 short-handed goals and gave up 69 goals while shorthanded, for a difference of -63 (worst in the league).

There is a huge difference between all goals and special team goals. To see why PP and PK goals are rated so much below All goals, it helps to see the point difference for even strength goals (EV Goals).
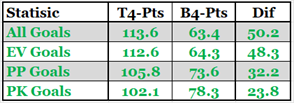
The reason that All goals are higher than the other three categories is that there are more “all goals” than the other three categories. By and large, the smaller the number of goals in a category, the less important it turns out to be. PP and PK goals would be less important than second-period goals, as more goals are scored in the second period of games than are scored on powerplays.
I was surprised to see that a good power play (32.2) was more important than a good penalty kill (23.8). This wasn’t caused by there being more powerplay goals than penalty kill goals, as a powerplay goal scored by one team is a penalty kill goal conceded by the other team. I see no reason for this to be the case, but the gap is so large there should be a reason.
From Goals to Hits, Oops, I Mean Blocks
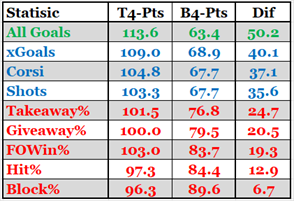
Now you can see why different row colours were used in the building block, foundational and cornerstone sections.
I did not include PP Goals and PK Goals in this summary table, to avoid confusion: they would have been between the blue rows and red rows. A casual reader could assume that shots were more important than powerplay goals. The correct way to understand those two data is that it is better to dominate opponents over entire games (by having better shot statistics) than it is to dominate opponents for a small portion of a game (by having more powerplay goals).
Summary
Using this method, blocks are shown as less important than hits. Yet my position on hits hasn’t changed. Hitting is the act of a team that is losing, and I don’t like one-dimensional players who deliver hits. I would like to take a few lines to show that my opinion on hits is based on facts.
The following table shows Productivity Rating Category counts for the top 54 players (three teams’ worth of skaters) in goals, takeaways, blocks and hits. Productivity Rating is a measure of a player’s season; last season there were 22 PR-Elite players in the league.
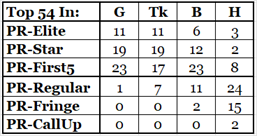
Great players score goals and take the puck away from the opponents; very good players block a lot of shots; a few good players deliver a lot of hits (J.T. Miller, MacKenzie Weegar, Rasmus Dahlin) but most are regular or fringe NHLers.
Unpopular opinion: Toronto would be better if they didn’t play Ryan Reaves. Honestly, have they not got better players in their AHL affiliate (the Toronto Marlies)?
Related Articles
