
Every team plays games where they outplay their opponents, even Chicago. And every team plays games where they are outplayed, even Winnipeg. Teams play a spectrum of games.
Using the same data that was used in Winning Winnable Games, this article will define the spectrum of games using a “statistic” called Outplay (OPL). It will use OPL to show the distribution of games played for selected teams.
But first, let me talk about a problem with the data.
Terminology
iG, ixG – individual goals scored, individual expected goals
iFin – individual finishing, a measure of how good a skater is at scoring goals (iG – ixG)
iGA, ixGA – individual goals against, individual expected goals against
iSvAA – a measure of how good a goalie is at preventing goals (ixGA – iGA)
xGF, xGA – expected goals for and against, team level
The Data, With One Obvious Problem
The data, copied from NaturalStatTrick.com, consists of 4,727 games played from the start of the 2021-22 season until January 26th, 2025. It consists of three seasons of recent data and one partial season of current data.
The data set has one obviously incorrect entry: a game played between Toronto and Carolina on March 24th, 2024, had no expected goals data. More technically, the expected goals data had 0.00 values at the team level, which was clearly incorrect.
I had three options on how to handle this situation. My first option was to check the detailed game reports to see if the players had expected goal data. If they did, I could just add up those data and stick them in my dataset. Each player in the game also had 0.00 for their expected goal data. Now, I had to consider the other two options.
Those options were to delete the game from my dataset or use the data as it was. The game score played a large factor in my decision: it was a 2-1 game. It was probably a closely played game, so I decided to keep the game.
Toronto has 295 games in the data set, with an average expected goals for (xGF) of 3.334, including this game. If they had actually had 1.5 expected goals in that game, their average xGF would have been 3.339. It is an imperceptible difference.
Outplay – Scores and Categories
Outplay (OPL) is the difference between one team’s expected goals for and their opponent’s expected goals for. For example, Detroit played in Boston on November 4th, 2021. Detroit had 1.11 expected goals for in the game, and Boston had 2.75 expected goals. Detroit’s OPL-Score was -1.64, Boston’s was +1.64. Boston won the game 5-1.
In a game, each team’s OPL-Score is the negative of their opponents (+1.64 is the negative of -1.64). There were 11 games where both teams had an OPL-Score of 0.00.
Seven categories were created based on OPL-Score, as category counts make it easier to show what a team has done and how they have played. The following table shows how OPL-Scores were used to place a game in a category, the idea and name of the category, and the count of games in that category. Font colours were used because “spectrum”. The middle rows required shading because pale-coloured letters on a white background are hard to read.
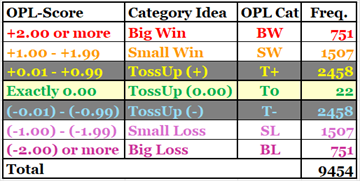
The total is 9,454 because each of the 4,727 games featured two teams. The distribution is adequately “bell-shaped”, with more games in the middle and fewer on the extremes. I could have hidden the T0 games in the T+ and T- categories (home teams assigned to T+, visiting teams to T-), but left them in the middle instead.
Outplay Results
As expected, the bigger the gap in expected goals, the better a team’s results.

This data confirms that expected goal data is related to a team’s results from a game. If this wasn’t true, expected goal data would be essentially meaningless.
Team Outplay Distribution
The table that displays how a team has played is introduced below. Vancouver will serve as our exemplar.
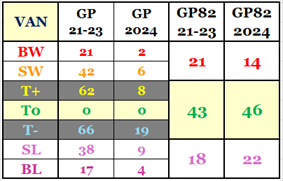
The first two columns contain games-played counts by OPL Category for two periods to time, 2021 to 2023 and then 2024. These columns serve very little purpose other than to “show my work”, as my high school math teacher asked me to do. The font size in these columns has been reduced so as to de-emphasize the content.
The columns of import are the two on the right, which show the count of games played per season (82 games – hence “GP82”). The design of the chart says, “Look at these columns on the right: they are easier to read!”
The columns on the right have only three values instead of seven. The numbers are the 82-game average of the corresponding game counts in the detailed area on the left. Vancouver played 63 (24+42) “winnable games” (BW, SW), which is 21 games per 82 games played.
From top to bottom, the three numbers represent how many times they outplayed their opponents, how many times the game was a toss-up, and how many times they were outplayed.
What does Vancouver’s chart tell us? From 2021-22 to 2023-24, Vancouver slightly outplayed their opponents (21 winnable games, 18 losable games). In 2024-25, that has changed: they have been outplayed much more often (14 winnable, 22 losable).
Was Vancouver in a funk through the first 50-ish games, or were they in a state of decline? It will be interesting to see what happens in the rest of the season now that they have traded J.T. Miller away. That may well show us whether it was funk or decline.
The next three sections will show team outplay distributions for three top teams, three bottom teams and two teams who had similar play but different results.
Outplay Distribution – Three Top Teams
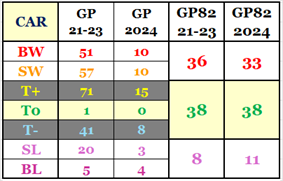
The average Outplay Distribution is 20-42-20. The average team would outplay their opponents as frequently as they are outplayed.
Carolina’s Outplay Distribution is heavily skewed towards them outplaying their opponents. If you are surprised to see them as a top team, you shouldn’t be: They earned the second-most points in the league from 2021-22 to 2023-24.
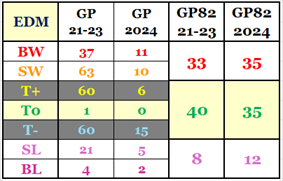
Edmonton’s play was not quite as strong as Carolina’s in the three previous seasons, but it was close.
In 2024-25, Edmonton’s play has been more extreme. They have more BW and SW games than T+ games (normally, a team would have more T+ games). They are playing fewer toss-up games this year: it’s more feast-or-famine.
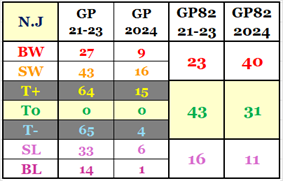
New Jersey’s play has improved significantly this season, having gone from 23-and-16 to 40-and-11. In the standings, they have vaulted from 21st over the last three seasons to 9th. With a couple of good results over three games, the Devils could be a top-four team in the standings..
Outplay Distribution – Three Bottom Teams
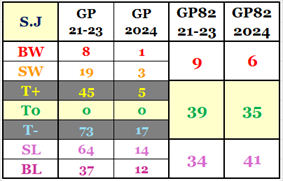
These numbers are not a surprise. To an extent, San Jose shows that hockey is a team game.
They had a defenseman (Erik Karlsson) who posted one of the best seasons ever for a defenseman, and they missed the playoffs by 100 points. Okay, it was 35 points, but still.
San Jose didn’t mind losing games while letting Karlsson play with abandon: it put bums in the seats, and they weren’t going to make the playoffs.
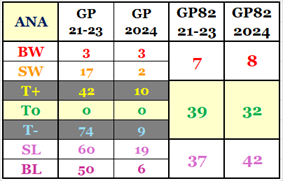
There is not much difference between Anaheim’s Outplay distribution and San Jose’s. Anaheim gets outplayed about five times as often as they outplay their opponents.
How many years before they become contenders for a playoff position? My guess is three seasons. There is no “overnight cure” for their situation.
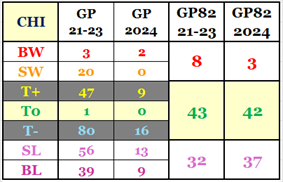
And finally, we have Chicago. The play of San Jose, Anaheim, and Chicago in the previous three full seasons can be described as “poor”, but Chicago has taken a step back this season. The best description for their play is “woefully inadequate.” Connor Bedard is very promising, but he is not yet at the stage where he can propel a team into contention. Neither Connor McDavid nor Auston Matthews could propel these Blackhawks into contention.
Outplay Distribution – Two Equivalent Teams
This section may contain some unexpected results. I’m going to say that the Ottawa Senators have been playing about as well as the Winnipeg Jets since 2021-22. Here’s the data.
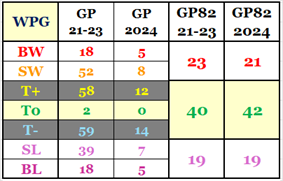
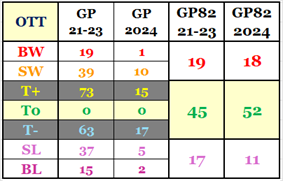
Winnipeg’s play from 2021-22 to 2023-24 was marginally better than Ottawa’s: 23-and-19 as opposed to 19-and-17. This season, Ottawa has improved and is playing better than Winnipeg: 18-and-11 compared to 21-and-19.
If your argument against the proposition that Ottawa is playing better than Winnipeg is that Winnipeg has had a huge advantage in the standings, I’ll concede that the Jets have had much better results than Ottawa and then tell you that that has no bearing on the proposition. In fact, I’ll show you the cumulative regular-season standing data for these teams since 2021-22.
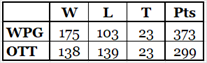
The difference between Winnipeg and Ottawa is not in their play, it is in the results. Both teams have more expected goals for than against. One team capitalizes on their offensive chances and stymies the opponent’s offensive efforts, and the other team is Ottawa.
Without naming names, Winnipeg forwards are much better at finishing (scoring). Since 2021-22, Jet forwards have 821.7 expected goals and 828 actual goals; Ottawa forwards have 812.1 expected goals (9.6 fewer) and 770 actual goals (58 fewer). But what fun is it to not name names?
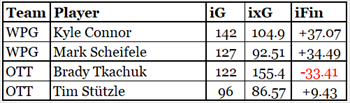
If Tkachuk could score with the same effectiveness as Connor or Scheifele, given the chances he has had, he would have had more than 2o0 goals since 2021-22 instead of “only” 122. If only Norris could give him some pointers (Norris has the best iFin on Ottawa in the period being analyzed).
The statistics are even more in conflict when looking at goalies, but it must be remembered that Winnipeg’s goalie, Hellebuyck, has been the best in the league for several seasons.
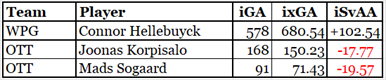
Not shown in the table is the sheer number of goalies that Ottawa has used since 2021-22: eleven. Winnipeg has used four. Of the goalies whose data is shown, Hellebuyck has reduced Winnipeg’s goals against by just over 100, while Ottawa’s two goalies increased Ottawa’s goals against by nearly 40 goals.
This section is lengthy because I wanted to reinforce that gameplay, as measured by expected goal data, is not an absolute predictor of game results. Ottawa and Winnipeg have similar expected goal data and similar OPL data, yet Winnipeg has had far better results because they have players who are more efficient at scoring and a league-leading goalie.
Summary
Was it shocking to see that the game data available on the internet has problems in it? It wasn’t for me, but I’ve been playing with hockey data for years now, and this wasn’t the first time I’ve seen incorrect data.
I normally look at season-level data, so if there is a problem with detailed data from a game or two in the season, it has almost no impact on the data. I’ve never seen a problem with important data (goals, assists, time-on-ice), and I don’t lose sleep worrying that a player should have had 177 hits instead of 174.
I know that the data I use is probably imperfect. But, like my math marks in Grade 13, I’ll take 99% even though I wanted 100%.
Related Articles