
While working on the 2023-24 Mid-Season Player Ratings article, I noticed that three teams each had two players in the top seven league leaders. Here’s the specific table.
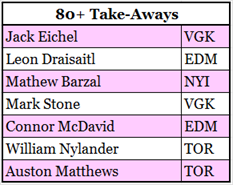
The question I posed in the other article was: “Are these three teams particularly adept at takeaways, are those six players particularly adept at takeaways or do their home-town game statisticians interpret takeaways much more liberally than others?”
Let’s ask the data. But before we ask the numbers, let’s consider the counters.
Game Statisticians
I decided to call the people who record events “game statisticians,” favouring that adjectival phrase slightly over “official scorer.”
I assume that each team has a regular set of game statisticians that work all of a team’s home games in a given season. If a team has statisticians who liberally hand out takeaways, their players will have more takeaways than players on a team whose statisticians rarely hand out takeaways.
The first thing to do is examine team takeaway totals. We need some data.
The Data
The data were retrieved from NaturalStatTrick.com for all games played in the 2023-24 season up to the date of January 8th, 2024. (I used the same last date as was used for the mid-season report.)
The data came from all manpower situations. Traded players had multiple records, one for each team they had played for. As I’m looking at how home-team statisticians may affect a player’s takeaway count, I split the data by home and away games.
Team data was collected from the same set of dates, and also split home and away.
Manipulating the Data
The data manipulation plan involves expanding current statistics to a full-season level, looking to see where those statistics indicate that game statisticians have differences in opinions, and then adjusting the data to remove those differences.
In my earlier article, I extrapolated (which is similar to “expanded”) player-level data based on the games they had played and the games their teams had played. In this article, I’m taking things one step further and extrapolating data based on home and away games played.
Grammatical aside: in the last sentence of the paragraph above, “further” is correct and “farther” would be wrong. Further is for discussing the degree or extent of an action, while farther is for discussing literal, physical distances. I could go further, but that would make this aside go farther, so I won’t.
This extra level of precision in the extrapolation process creates slightly different season-level counts than were used in the mid-season player ratings article, but they are only slightly different. Connor McDavid (EDM) was projected to have 84 takeaways in the mid-season article and is projected to have 85 takeaways in this article. You would not know the underlying counts are different because the mid-season article did not include counts (the list was of the names of players who were on track to have 80+ takeaways), but I thought it was appropriate to let you know that different processes can produce different results.
The first step in the manipulation involves taking the year-to-date data and expanding it to the season level.
Getting Season-Level Data
Teams have played different numbers of home games, different numbers of road games and different numbers of total games. To do comparisons fairly, I will extrapolate the existing data to 41 road games and 41 home games (for a total of 82 games, or one season).
Our exemplar for these calculations is Dylan Larkin of the Detroit Red Wings. The defensive side of his game is pretty good if you don’t know. Do I need to say that TA means takeaway and GP means games played?
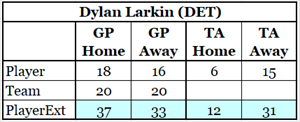
The first row shows what Dylan Larkin has done this year, home and away. The second row shows how many games the team has played, home and away.
The third row shows Larkin’s extrapolated data. He has played 18 of 20 home games for Detroit, which extrapolates to 37. His extrapolated away game count is 33.
His extrapolated takeaway total is based on his actual games played, his actual takeaways and his extrapolated games played. At home, that works out to 12 TA: ((6 * 37)/18). On the road, that works out to 31 TAs. All of the extrapolated values are whole numbers because you cannot get credited for one-quarter of a takeaway.
Having done this for every player, I added all of the Home and Away extrapolated TA counts by the team(s) they played for. The extrapolated total TA for Detroit players is 199 in home games and 214 in road games. Is that a lot or a little? Do all teams get more takeaways on the road? Let’s look at the team-level data.
Team-Level Takeaways
In the chart below first thing to look at is how many takeaways each team has at home. The measurement is TA/GP.
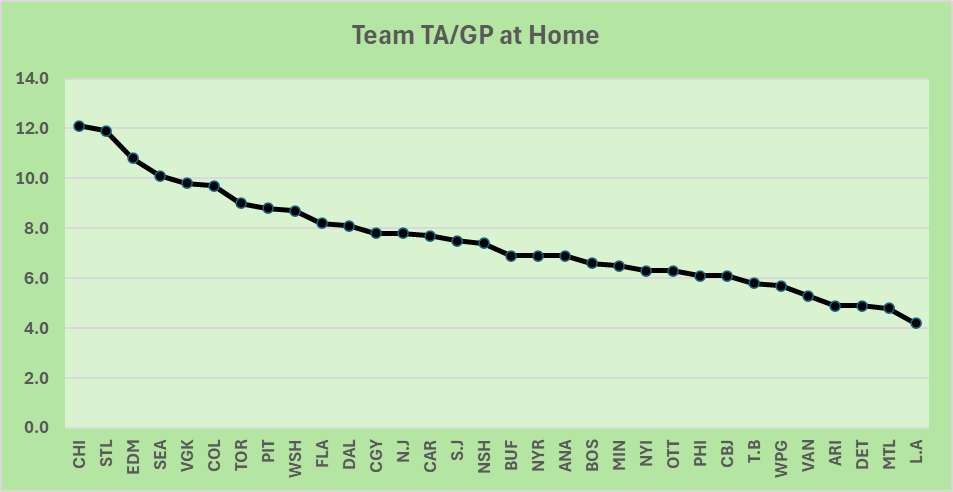
Teams were sorted from most takeaways per game played (Chicago, 12.1) to least (Los Angeles, 4.2). The league average is 7.5 TA/GP at home. The Detroit statistician is nearly the lowest in the league, doling out 4.9 TA/GP. This line chart shows there is quite a disparity between takeaways recorded by the home statistician for the home team.
Now each team’s away TA/GP will be added to the chart, using a red line.
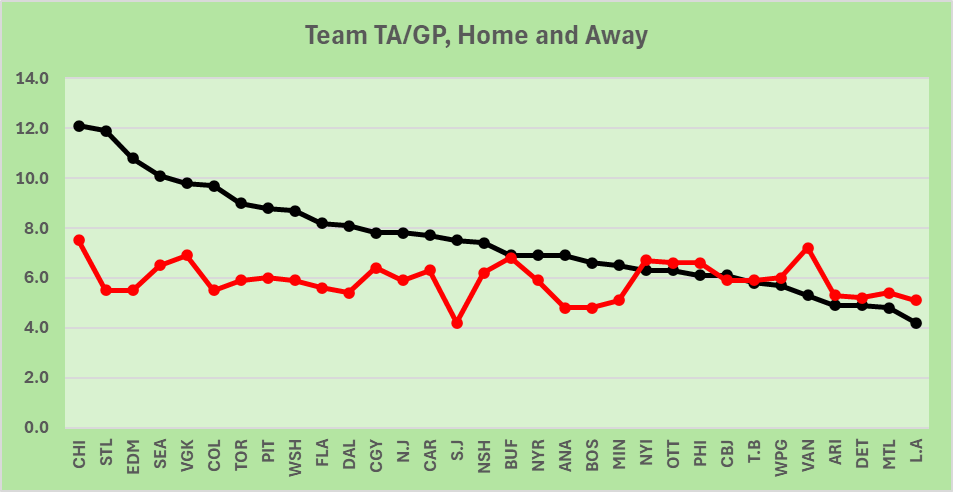
That second chart tells us quite a lot, doesn’t it? Two things stand out to me: counts of takeaways on the road are much more consistent, and away teams get credited with fewer takeaways than home teams. Chicago leads the league in a way TA/GP at 7.5, while San Jose has the least TA/GP at 4.2. The league averages 5.9 TA/GP on the road.
What can we do with this information? We can use it!
The Wisdom of the Crowd
According to Wikipedia, the “wisdom of the crowd is the collective opinion of a diverse independent group of individuals rather than that of a single expert.” Each team’s game statisticians are single experts, while all of the game statisticians in the league are a diverse group of individuals.
An individual expert’s observations, such as whether a specific play was a takeaway or a giveaway or neither, are affected by the scorer’s unique interpretation of the play. A group’s observations are often superior to those of an individual, as the extreme interpretations of individuals tend to balance out.
It is important to use the wisdom of the crowd with a grain of salt. As this analysis moves forward and adjusts player takeaway counts, the results should be considered as a step towards the truth rather than the truth itself.
Adjusting a Player’s Takeaway Count Using the Wisdom of the Crowd
I will use the Wisdom of the Crowd on a player’s extrapolated takeaway counts to create adjusted takeaway counts. That wisdom tells me two things: first, road takeaway counts are more reliable the home takeaway counts; second, players average 1.27 takeaways at home for every 1.00 takeaways on the road.
To get an adjusted season-total takeaway count for a player, I will adjust his home takeaways to be 1.27 times the rate of his road takeaways. This is a good time for Dylan Larkin to come off the bench and get involved in the play.
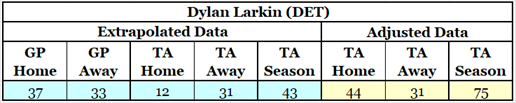
Dylan averages 0.94 TA/GP on the road. His home TA/GP should therefore be 1.19 TA/GP (1.27 * 0.94). This means his home TA count should be 44 (1.27 TA/GP * 37 GP).
As Detroit plays in front of a statistician whose takeaway-recognition factor is one of the lowest in the league, the adjustment process will give Red Wing players a big boost in their Home TA count.
For a bit of contrast in how the adjustment process works, let’s look at the numbers for one of the seven players identified as league takeaway leaders at the start of this article. Leon Draisaitl (EDM), come on down!
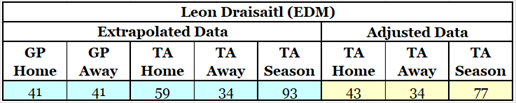
Draisaitl had played all Edmonton games as of January 8th, so he is extrapolated to play all games in the season. Edmonton’s scorer hands out takeaways like a broken water main hands out water, so his adjustment produces a drop in home takeaways.
Extrapolated and Adjusted League Leaders in Takeaways
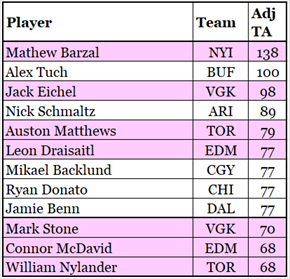
In this final table, the coloured rows identify the players who were on the original list. The first nine rows are the top nine players based on adjusted takeaways, while the final three rows show the counts of players who were in the original list but didn’t stay at the very top of the league. Those final three players are still at the top of the league, just not at the very top: McDavid and Nylander are tied for 19th.
Mathew Barzal (NYI) received the biggest adjustment in Takeaway counts. Not only is the Islander game statistician a little parsimonious in handing out takeaways, but it looks like he was out of the scoring booth when Barzal was on the ice. On the road, Barzal had a TA/GP of 1.56, while at home (where the wisdom of the crowd would have us believe his TA/GP should be higher) he had a TA/GP of 0.80. His adjusted home takeaway count was 44 higher than his unadjusted count.
Answering The Question(s)
The question was: Are these three teams (EDM, VGK, TOR) particularly adept at takeaways, are those six players particularly adept at takeaways or do their hometown game statisticians interpret takeaways much more liberally than others? Let’s break that down into three questions and reword them slightly.
Are the players of Edmonton, Vegas and Toronto particularly adept at takeaways? Using the wisdom of the crowd, I’d say that Vegas is particularly adept, Toronto is average, and Edmonton is slightly below average.
Are the six players particularly adept at takeaways? Yes, they all are, even when their takeaway data are adjusted downward because their home-game statisticians hand out a lot of takeaways.
Do the statisticians in Edmonton, Vegas and Toronto interpret takeaways more liberally than other statisticians? Yes, they do. The league average ratio of home takeaways to road takeaways is 1.27:1. That ratio in Vegas is 1.42:1 (not too much higher), Toronto’s ratio is 1.53:1 (higher) and Edmonton’s ratio is 1.96:1 (much higher, second highest in the league).
Summary
The research for this article was fun. It involved a little thinking, a little extrapolation, a couple of adjustments to numbers, and a slight modification to how I present line charts (the charts used in the Team-Level Takeaways section).
Is it possible that the data show that specific teams play differently at home than on the road? To the extent that flying saucers are possible, it is possible. The question then is why a team would adopt a road strategy that results in them getting fewer takeaways.
This is the second judgement statistic that Stapled To The Bench has investigated, and the second such statistic to be affected by the way home-team statisticians evaluate events. The other article looked at hits (Thoughts on Hitting).
Related Articles
2023-24 Mid-Season Player Ratings
Thoughts on Hitting