
One of the main reasons that Productivity Rating (PR) was created was to do studies of groups of players over time. Studies like: when do players hit their peak value; which draft classes had the most talent; what is the value of a draft pick?
In this article, I’ll look at the value of a draft pick.
The Search for a Relatable Number
My first thought for this article was that I would rate draft picks by the accumulated PR-Scores of players over several seasons immediately after they were drafted.
It struck me that the total PR-Score for a player across several seasons would be as useful as the total marks from my Grade 13 report card. Would it mean much to say that it was 588? It would mean very little, as very few people (aside from me) would add their marks. My average mark (84 on 7 classes, dragged down by a 61 in French) would be a little more meaningful, because most people understand what individual marks mean: 95 is great, 85 is pretty good, 61 means you don’t have to write the final exam, and under 50 means you probably think you can do your own research on COVID.
The general public has no understanding for PR-Score at the individual season level, so the total PR-Score over six seasons would be extra meaningless. If I said that Player A had a total PR-Score of 28 and Player B had a total PR-Score of 9, then you’d know that A was better than B, but would have no idea how good either player was. Is player A Connor McDavid or Kyle Connor or Conor Sheary? To satisfy your curiosity, looking at the 2016 draft class (where Auston Matthews was the first pick), player A would be a guy like Samuel Girard, while Player B would be a guy like Janne Kuokkanen.
I wanted a number that: 1) relied on PR for its value, b) was meaningful to the general population, and thirdly) passed along some information about a player’s value by itself. I could have gone for a grade-like scale, but money won out. As it always does.
I created a method that converts a player’s PR-Score to a dollar figure. It is called Return From Play (RFP). The concept is that the better a player plays (the higher his PR-Score), the more valuable his season was.
I will use RFP in many future articles. It will be a central part of two other draft-related articles that are being worked on at the time of this writing, and a future article on the evaluation of a trade.
Converting Productivity Rating Score (PR-Score) to Return From Play (RFP)
The range for RFP for a season is between $800,000 and $12,500,000, a range that is a fair approximation of the 2021/2022 NHL salary rules. A player that played no games in a season provided no return for his play, so his RFP for that season would be $0. Players who were in the PR-CallUp category will have their RFP based on the minimum and the number of games they played. All other players’ RFP will be based solely on their PR and will be in the range $1,250,000 to $12,500,000.
To give the gentle reader a sense of the results of the method, the table below shows 17 somewhat-randomly selected players and their 2021/2022 Return From Play (RFP).
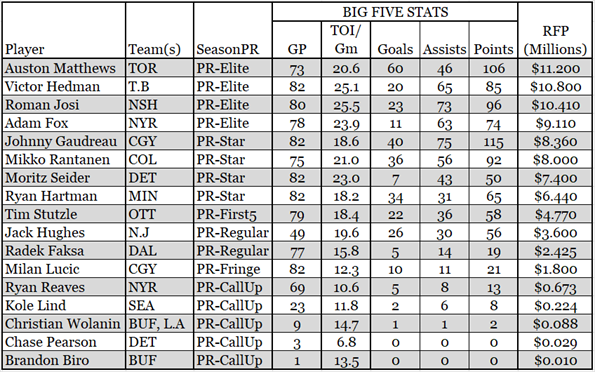
Lucic and Reaves are over-valued (in my opinion) by this method, but I’m not going to scrap a really good process because it isn’t perfect.
A team would be happy if a player’s RFP is higher than his contract’s average annual salary because they are getting more bang for their buck. If they are paying a player $3.5M and he is producing like a $5M player, what’s to be sad about? A player would be happy with playing above his salary level too, for a short while, as it should lead to a future contract that is bigger. When a player’s RFP starts to slip below his annual average salary, he may not be long for the league, unless he goes to Toronto and voluntarily plays for the league minimum.
Study Details
Players will be evaluated on the six seasons after their draft. Six years is used because it is a period of time when the draftee should be under the complete control of the drafting team, and because no general manager is seriously looking at a longer time frame.
Since I’m using PR-Score as the statistic of analysis (RFP is based on PR-Score), I can only go back as far as the 2007 draft. The statistics required to calculate PR are not publicly available for seasons before 2007/2008.
Since I need six seasons of data, I cannot use players drafted 2017 or later, as they haven’t had the chance to play six seasons yet. And since PR doesn’t do goalies, goalies are excluded.
Grouping The Drafted Players
Players will be placed in groups, which greatly simplifies the work I have to do. Instead of looking at more than 200 draft slots, I’ll look at nine groups. The draft groups are:
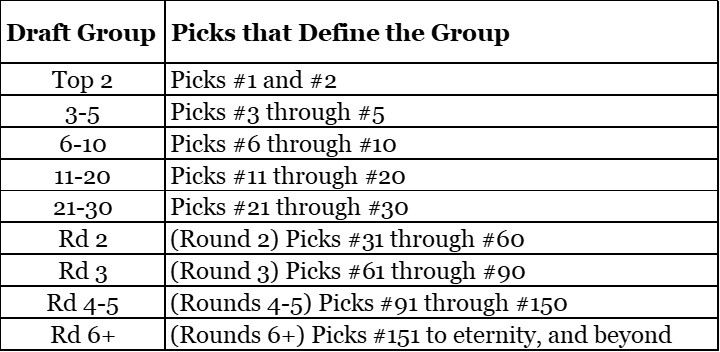
I know that the first round of the draft presently has 32 slots, but there haven’t always been 32 players in a drafting round. Using groups of 30 keeps things a little simpler for me, and everything I do is about keeping things simpler for me.
PR Breakdown by Draft Group
The following table shows the accumulated season ratings of the drafted players. The first five rows define the groups for the top 30 picks, while the next four rows define groups based on my definition of Rounds. Rd 3 means Round 3.
Since this table is a wall of numbers, I highlighted cells in orange if they contained a value of 15% of more, and deleted text from cells that were less than 1%. It clarifies the table nicely.

The table confirms that the draft groups are appropriately defined. Each group is better than the ones after it, and worse than the ones before it. Rd 3 looks very similar to Rd 4-5, but that’s an illusion caused by rounding. (1.2% and 0.7% both round to 1%.)
The table also confirms that the people who make the draft picks know what they are doing. The later a player is drafted, the less likely he is to have a good career, because the players who are more likely to have good careers have already been drafted.
Value of a Draft Group
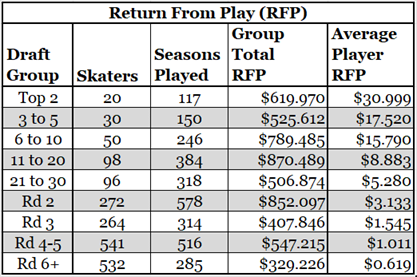
Thanks to the miracle of modern computers, it easy to put the RFP method to work. The Return From Play table below shows draft groups, the number of skaters in the group (excluding goalies and excluding picks removed from a team as punishment), the number of seasons the drafted skaters played in the first six years after their draft, the group’s total Return From Play, the average RFP for a drafted skater in the group.
All dollar figures in the table are in millions. I’ll provide a little more info for each group following the table: the best player, the closest-to-average-RFP player, and the player with the lowest RFP.
Draft Group: Top 2
The Top 2 draftee with the highest return was Connor McDavid (ldo) at $53,980,000; closest to average was Jack Eichel at $30,930,000; the lowest return comes from Nail Yakupov at $11,040,000.
Perspective is an interesting thing. Had Nail Yakupov been drafted 21st, he would have been considered a good pick, certainly an above average pick. But he was drafted first, and his career was disappointing.
Draft Group: 3 to 5
The highest return came from Leon Draisaitl ($38,681,000); closest to average is Adam Larsson ($18,929,000); lowest return comes from Griffin Reinhart ($361,000). Mr. Reinhart played 37 NHL games in his first six post-draft seasons.
Draft Group: 6 to 10
Three players were virtually tied for highest return: Ivan Provorov is at $32,760,000 while Matthew Tkachuk is at $32,650,000 and Sean Monahan is at $32,510,000. Closest to average is Matt Dumba at $16,062,000. The lowest return came from Scott Glennie ($9,756) who played one game in the NHL in his career.
The 3 to 5 group and the 6 to 10 group are the most alike, in terms of return from play. Normally the RFP of the lower group is 50% to 65% of the RFP from the higher group, while for these two groups it is 90%. “Most alike” does not mean “alike”. In the 2021 season, Nick Holden (OTT) was 90% as good as Oliver Ekman-Larsson (VAN).
Draft Group: 11 to 20
The head of this group is Erik Karlsson with an RFP value of $29,910,000. Luke Kunin was the closest-to-average player for this group, at $8,885,000. Two of the draftees in this group were goalies, leaving 98 drafted skaters. The least return honours are shared by four players who did not play in their first six post-draft seasons (RFP=$0).
Draft Group: 21 to 30
David Pastrnak ($29,840,000) has the highest return for this group of players. Mark Pysyk was closest to that average, with a return of $5,218,000. Tied for lowest return are seven skaters who did not play in their first six post-draft seasons.
Draft Group: Rd 2 (picks 31 to 60)
The highest return from any player drafted in Round 2 comes from Sebastian Aho with $32,420,000. Alex Petrovic was the closest to the average player at $3,138,000. 83 of 272 round two skaters did not play in the period of the study.
I was stunned to see that 30% of skaters drafted in the second round did not play an NHL game in the six years after their draft.
Draft Group: Rd 3 (picks 61 to 90)
Adam Fox leads the group with $24,590,000 in returns, even though he played less than half of the scheduled games in his first six seasons. Fox, a young defenseman for the New York Rangers who has shot into stardom these last couple of seasons, was drafted by the Calgary Flames. In another article RFP will be used to evaluate Fox’s journey from Calgary to New York to determine which team came out on top. Spoiler alert: one team absolutely lost.
The player closest to the average RFP for this group is Keegan Kolesar ($1,610,000). 132 players tied in providing the lowest return at $0. Exactly one-half of the 264 skaters drafted in round 3 did not play in the NHL.
Draft Group: Rd 4-5 (picks 91 to 150)
Jamie Benn leads this group with an RFP of $19,220,000, with Viktor Arvidsson a hair’s width behind him at $19,194,000.
No player is particularly close to the group average, due to the unusual combination of the group’s average RFP ($1,011,000) and the method for calculating RFP. Bracketing the average is Tom Kuhnhackl at $1,350,000 and Seth Griffith at $771,000. Kuhnlackl first played in his sixth post-draft season and had a PR-Fringe season, while Griffith had four PR-CallUp seasons.
333 of the 541 (62%) skaters drafted in the fourth and fifth round did not play a game in the NHL in the first six seasons after they were drafted.
Draft Group: Rd 6+ (picks 151+)
Ondrej Palat leads the group with an RFP of $19,219,000. Sami Niku ($585,000) is closest to average. 409 of 532 (77%) skaters drafted after the fifth round did not play in the NHL.
Around Ottawa, Mark Stone is usually cited as an example of the value you can get in the late rounds. Stone was drafted at pick #178. His RFP is $12,684,000, making him sixth best in his draft group. His return is what you would expect from somebody drafted with the tenth pick. People shouldn’t be praising the Ottawa draft team for this pick: they got very lucky. If they were truly smart, they would have picked him at #76 instead of Jakub Culek (RFP: $0), or at #106 instead of Marcus Sorensen (RFP: $0). Ottawa didn’t have a first or second round draft pick because of trades they had made.
Chase Priskie was drafted #177 in 2016 and has played fewer than five NHL games. He’s a better example of the “value you get late in the draft”. More than three-quarters of the players drafted in rounds six and seven did not play an NHL game in the six seasons after the draft. These draftees will usually max out in the AHL.
Summary
The RFP method puts an NHL-salary-cap respecting dollar figure on a player’s season, stating his productivity from a financial viewpoint. By accumulating the RFP of all drafted players from their first six post-draft seasons, it was possible to assign monetary values to groups of draft picks. RFP is another way of stating the expectations we have for players based on where they are drafted: we expect this draftee to be a $3M a year player.
Real Life Example #1
In April of 2021, David Savard was traded from Columbus to Tampa Bay by way of Detroit. Columbus received a 2021 first-round pick (#32 overall) and a 2022 third-round pick (#96 overall) from Tampa Bay.
Savard wended his way to Tampa Bay by way of Detroit, strewing salary cap money as he bounced from team to team. Columbus retained half of his $4.250 million cap hit, and Detroit retained half of the remaining cap hit. Tampa sent a fourth-round pick to Detroit for their troubles, pick #128 overall.
According to the RFP calculations, the value of picks between 91 and 150 is $1,011,000. According to math, one-half of one-half of $4.250 million is $1,062,500. This isn’t proof-positive of the accuracy of RFP, but it is a good indication that the draft values established by RFP are close to the values understood by general managers in the NHL.
Real Life Example #2
This article was written during the 2022 playoffs, after the draft lottery had been conducted.
In Ottawa, the sports radio station has had a few fans saying Ottawa should package their #7 pick and a prospect to move up to the #2 pick. What can I say? Some fans are impervious to logic. According to the pundits this draft does not have a ton of top-end talent. The difference in quality of this year’s #2 and #7 picks is less than it would normally be.
New Jersey currently owns the #2 pick. If somebody wants it, I’m confident the Devils would ask a high price, because the #2 pick is sexy. They’d probably ask Ottawa for the #7 pick and a prospect named “Stützle.” They would never, never, never, ever trade their second pick for #7 and Tyler Boucher, a recent #10 pick of the Senators.
The fact that Ottawa drafted Tyler Boucher at #10 doesn’t mean that he’s a #10 player. When you go “off the board” and pick somebody at #10 that might still be available at #40, you take a big risk. Will Boucher be Ottawa’s worst draft pick ever? He will be if his RFP is that of a player picked at #40.
If Boucher ends up playing like a #10 pick, I’m going to owe the Ottawa Senators and Tyler Boucher an apology. If he doesn’t, the Senators will owe him an apology.