
Sometimes you look at sports statistics and say to yourself, “that doesn’t make sense.” Well, maybe you don’t do that, but I do.
In some cases the data may not make sense, but it can’t be denied. For instance, a losing team that has a winning record in blowouts. It doesn’t make sense that a losing team would win more blowouts than they lose, but when it happens you can’t question the statistic.
In other cases, you can absolutely question a statistic, especially if it is a “judgement” statistic.
I was looking at hits for an article I wrote (Team Results Lists) that showed each team’s record in various situations: stuff like 1-goal games, low scoring games and home games. Two of the lists showed team records when they outhit their opponents by at least 10 and when their opponents outhit them by at least 10. For example, the Calgary Flames were 7-1-2 when outhitting their opponents by ten or more, 5-1-1 when they were outhit by ten or more.
The weird data wasn’t Calgary’s record when outhitting their opponents, but Calgary’s hit counts at home and on the road. The problem with hits is that the counts for some teams are wildly different between home games and road games.
Hit Data Oddity – The Extremes
In games played in Buffalo, the total hits averaged 26.0 per game. In Buffalo’s road games, the average total hits was 41.4. In games played in Tampa Bay, the total-hit average was 59.9. In Tampa Bay’s road games, the total-hit average was 42.3. Two teams had a difference of one hit per game in their road games, but 34 hits per game in their home games.
It’s important to note that in both cases, the ratio between a team’s hits delivered and a team’s hits received is consistent. In Tampa, the Lightning outhit their opponents 30.4 to 29.5. On the road, they outhit their opponents 21.4 to 20.9.
Many teams have home and road hit totals that are within 10% of each other. The Avalanche averaged 42.8 total hits in home games, 43.5 in away games. Ottawa averaged 53.3 total hits in home games, 55.4 in away games. Washington’s averages were 49.4 and 47.4.
The huge differences are not due to home/road strategy changes. The difference is most likely caused by different official scorers.
Hits are (is?) a Judgement Statistic
I didn’t find an official NHL definition of a hit. The official rulebook for the NHL weighs in at over 230 pages, and nothing in it defines a hit.
According to Quora, there are three guidelines for a hit. The player being hit must have the puck or have just gotten rid of it; the contact must impede the opposing player in some manner; the contact must be intentional and legal.
When it comes to hits there is room for interpretation. While this is true of almost any NHL statistic, the amount of interpretation that goes on for hits is provably huge.
Who Counts Hits in a Game?
The logical assumption is that game statistics are recorded by either a single statistician or a group of statisticians that are from the home team area. The names of statisticians are not part of the NHL game reports, so this can’t be proved conclusively. I can’t see the league paying a bunch of off-ice officials to travel from city to city to record statistics. It would be far less expensive to have local people do the job.
This was confirmed by a friend of mine who works with an NHL team.
Proving Bias
How do you prove that data is biased in some way? In this case, I think that the standard deviation of the home and road hit totals proves there is bias.
You can skip the next paragraph if you know what standard deviation is.
Standard deviation is a measure of the amount of variation or dispersion of a set of data values. A group of ten 50-year-old males could have an average weight of 200 pounds with a standard deviation of 35. A group of one horse, four fifty-year-old males and five kittens could have an average weight of 200 pounds with a standard deviation of 325. The second set of numbers is far more diverse and thus has a much larger standard deviation.
In the NHL the average total number of hits in a game is 45.9. When looking at a team’s home games, the standard deviation in total hits is 7.85; in away games, it is 4.66.
Home-game total hits vary more than the road game total hits. That’s because road teams play in front of 30 or so different game statisticians, some of whom will produce high hit totals, some low, most in the middle. Over the season, the different scoring tendencies of the road statisticians will balance out. At home, a team will play all of their games in front of a single statistician. Half of a team’s season’s statistics will be recorded by a single official scorer and the resulting data will be impacted by the tendencies of that score.
How to “Correct” Hit Counts
Because the away games are played in front of 30 or more teams of statisticians, I will assume that the away counts display the true nature of a team’s hitting frequency. Only the home counts need to be corrected.
As mentioned earlier, Buffalo games had a total of 26.0 hits per game at home, 41.4 hits per game on the road. To correct the Buffalo home game hit totals, all I have to do is multiply the actual totals from each game by 41.4/26.0, which is 1.59. For example, Buffalo hosted the Coyotes on October 16, 2021. Each team recorded 15 hits, but that was in Buffalo. Correcting for Buffalo’s statistician’s tendencies, the adjusted hit total is 24 for each team (23.85 rounded to the nearest whole number). Both teams’ hits were judged by the same statistician, so both teams’ totals have to be adjusted.
This adjustment was done for every game, adjusting the team hit total’s by the home team’s “hit adjustment factor”. Then the total adjusted hits in each game were calculated. The table below shows the six top teams in total hits per game, both the official counts and the adjusted counts.
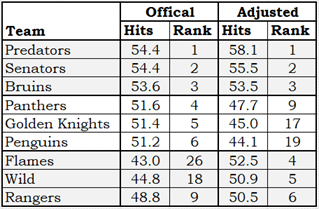
In the table on the left, the first six rows contain the top six teams in total hits per game, based on the official counts. On the right side of the table is the hit and rank information using the adjusted data. The bottom three rows show the fourth through sixth teams in the adjusted counts.
The top three rows have the same teams in the same order. The scorers for those three teams were all close to the league average when it came to counting hits.
I think anyone who has seen a few games of each team would agree that the Calgary Flames games feature more hits than the Pittsburgh Penguins games, in spite of what the official stats say. Officially, Pittsburgh games feature eight more hits than Calgary games. Adjusted hit data says that Calgary games feature eight more hits than Pittsburgh games: that is a difference of sixteen hits per game.
Correcting Hit Counts at the Player Level
Since team hits are the sum of all hits recorded by their players, it is possible to correct player hit totals using a similar process. Mathematically, this is called “sauce for the goose is sauce for the gander.”
The table below shows the top ten players in official hits (left-hand side) and in adjusted hits (right-hand side). The rank columns show a player’s rank in the other set of counts. Gudas is first in the official hit category (first data row on the left side) but is second in adjusted hits (the 2 under Adj. Rank indicates he’s second in adjusted hits; he’s on the second row on the right side). Towards the bottom of the list you see players that are in one top-ten for hits but not the other. Keegan Kolesar is 10th in official hits, 27th in adjusted hits. Milan Lucic is 9th in adjusted hits, 26th in official hits.
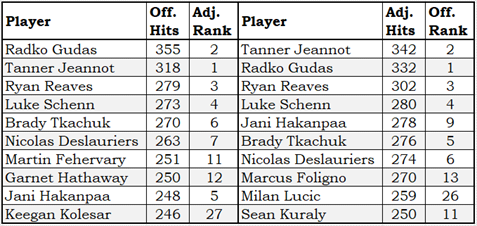
Milan Lucic was denied his spot in the list of top ten hitters in the league because of the way the official statistician in Calgary recorded hits. Officially, Kolesar outhit Lucic 246 to 209. Unofficially, Lucic outhit Kolesar 259 to 212.
Had Lucic played the season in Tampa Bay, where hits are credited liberally, he would probably have led the league in hits. He wouldn’t have hit opponents any more frequently, he just would have been credited for hits much more often.
Players With Biggest Adjustments
The next and final table shows the players whose total hits were adjusted the most by this process. On the left are players whose hit totals increased, while the right has players whose hit totals decreased.
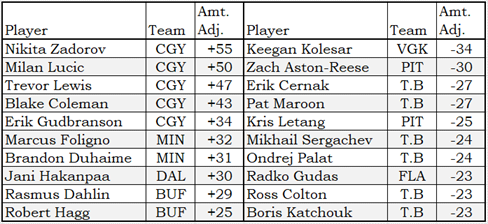
Buffalo, Calgary, Minnesota and Dallas are the four teams whose official scorers recorded the fewest number of hits. The ten players with the biggest increase in hit counts came from those four teams.
Tampa Bay, Vegas and Pittsburgh are the three teams whose official scorers handed out generously. An unconfirmed rumour indicates that one game in Tampa had three hits recorded while the national anthems were being played.
Summary
I spent quite a lot of effort on this article, which is a bit of a surprise given that hits are my least favourite statistic in the NHL.
Hits are held out by some people as a magic elixir that can create wins. Hits do not create wins. Teams that out-hit their opponents by at least 10 in a game had a losing record (151-161-41), while teams that are out-hit by 10 or more had a significant winning record (202-121-30). The teams doing all the hitting are the equivalent of an 80-point regular season team, while the teams getting all the hits are the equivalent of a 100-point team.
The point of hockey isn’t to outhit your opponents; it is to outscore them. Hitting is something a losing team can do to appease their fans. “We didn’t win, but we made it hard on them.” That’s just a longer way of saying, “We lost.”
At the end of the day, miscounted hits is somewhere between an extremely trivial problem and no problem at all. Teams are not winning or losing games because of the way an off-ice statistician categorizes an on-ice event.