
I’d like to share some thoughts on hitting in the NHL. My data source for this comes from bigdataball.com, from whom I purchased the play-by-play reports for each game in the 2022-23 season.
But before I use that data to investigate hitting, let me use it to investigate hits.
Chicken Vindaloo
Let’s say you are in an Indian restaurant looking at the menu, which has chili peppers beside dishes that are spicy hot. Some dishes have no peppers, others have one, two, or three. You would like to try their Chicken Vindaloo but notice that it has two chili peppers. If you are like me, your immediate thought is “two peppers according to whom?”
If the spice rater is a native of India, that Vindaloo sauce could sear my tongue to the roof of my mouth. If the rater is my aunt, who thinks that black pepper is incredibly hot, my tongue will be perfectly safe.
And what about the Indian restaurant two blocks away? I remember I couldn’t handle its Vindaloo dishes. Does it use the same standards for rating its dishes? We would all be slightly better off if there was a single standard for rating how hot dishes are, but society has bigger problems to solve first, so we’ll just have to live with it.
This Vindaloo problem is exactly the same sort of problem with hits in the NHL, minus the risks to my taste buds and the potential benefits for society. Game statistics are recorded by league-paid scorers; each team has its own set of scorers. A simple look at the statistics shows that different scorers interpret hits differently. For example, many events that are hits in Pittsburgh are not hits in Buffalo.
Judging the Hit Statistic
Let’s take the idea that scorers interpret hits differently to court. I am speaking for the prosecution, using game data as my evidence.
Exhibits A and B are charts that show the average number of total hits recorded in each team’s 2022-23 games. In a game played in Buffalo on January 12, 2023, the Sabres were credited with nine hits and the Jets with eighteen, so 27 total hits were recorded.
Exhibit A shows the averages from teams’ home games. Team names are not shown as they clutter up the display.
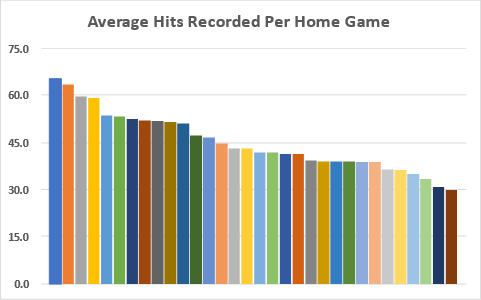
Exhibit A
There are four teams where the home scorers record 59 or more hits per game, and four that record 35 or fewer.
Exhibit B shows the team averages in road games shows a different picture. The data jumps around in this chart because the teams are displayed in the same order as in Exhibit A (descending total hits per game played at home).
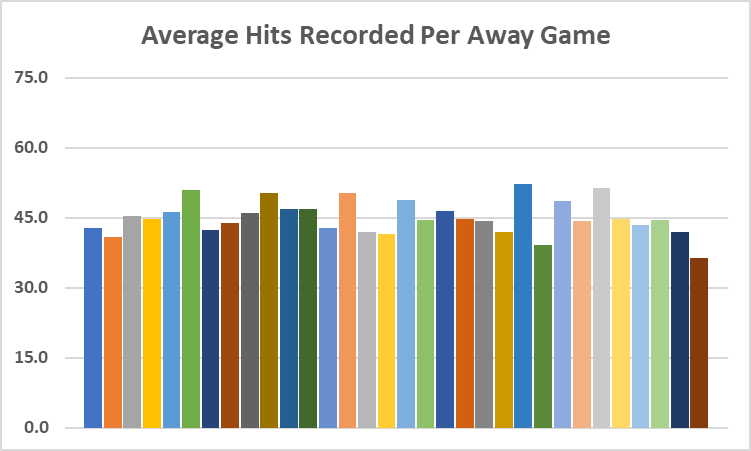
Exhibit B
On the road, no team averages more than 59 total hits per game, and no team averages fewer than 35 total hits. These first two exhibits show that many teams have vastly different total hit data in their home and road games. What sort of strategies and tactics would dictate this sort of change in playing style in half of a team’s games? Maybe you’d want to crank up the hitting against a couple of opponents, but if that was a strategy you were going to use against those opponents, you’d do it at home and on the road.
Exhibit C shows average hits per game by home teams over the last ten seasons.
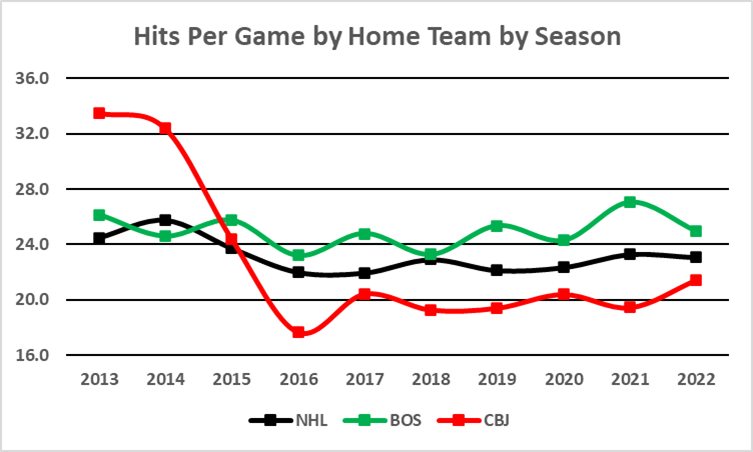
Exhibit C
The black line in the centre of the chart is the league average for home teams in each season. The green line shows Boston, where hitting has been fairly consistent at just over the league average. The red line shows the Columbus Blue Jackets, where hitting took a huge drop between 2014-15 and 2016-17.
Did the personnel in Columbus change? Of course it did: team personnel changes every year. The personnel in Boston changed every year as well.
Did Columbus lose a player who delivered 14 hits per game? Of course not: no player delivers that many hits per game.
Did the coaching in Columbus change in that time frame? Yes, it did. In 2015-16, noted firebrand John Tortorella took over behind the bench.
From this data, I infer that the official scorer in Columbus changed, probably partway through the 2015-16 season. If you think the scorer didn’t change, you’ll have to convince me that John Tortorella’s solution to the problems facing Columbus was to have his team hit almost 50% less frequently.
Finally, let me show you the player-level details of the Pittsburgh Penguins. The Penguins were the team on the very left side of Exhibits A and B, making them the team with the most total hits per game in their home games. Exhibit D shows the difference in hits-delivered-per-60-minutes in home and away games for players who played at least 150 minutes in both home games and away games (so they played at least 300 minutes over the season). The short form for hits-delivered-per-60-minutes is H60.
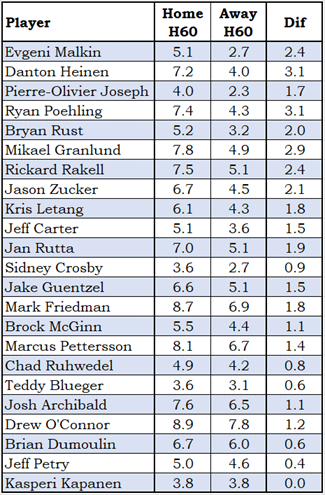
Exhibit D
23 players met the ice-time qualification for this calculation, and 22 of them had more hits at home than on the road, while one had the same hit rate. These players didn’t all score more at home, they didn’t all win more faceoffs at home, they didn’t all have more takeaways or fewer giveaways and they didn’t all block more shots. But they all had more hits at home, and I see no other explanation than that the Pittsburgh scorer sees hits everywhere.
The evidence that scorers have different interpretations of “hits” is overwhelming. The data shows that several scorers have an “observation bias”: they see what they expect or want to see rather than what is there.
I rest my case.
How To Use Data with an Observation Bias
The degree of observation bias for hits varies, from scorers who rarely see hits happening on the ice to those who score hits with unchecked enthusiasm. Because of this, the corresponding data should be handled carefully.
Let’s go back to the Chicken Vindaloo dish. It would be better if the restaurant’s ratings were the average of, say, 32 people (corresponding to there being 32 teams in the NHL). There will be a few people who find everything spicy, a few who find almost nothing spicy, and others will have varying tolerances to spiciness. Maybe then its Chicken Vindaloo would get a rating of 1.8 chili peppers.
Where possible, we want to use data from all scorers instead of from one scorer.
At the league level, all of the data can be used because the “too many hits” scorers will be balanced out by the “too few hits” scorers.
At the team level, the best approach is to use only data from the team’s away games, excluding data from the team’s home games.
The player-level approach is the same as the team approach: use data from away games and exclude data from home games.
Now, let’s investigate hitting.
Hitting By Period
The first of several surprises for me was that hitting wasn’t a constant throughout the game. Hitting happens most frequently at the start of a game and reduces in frequency throughout the game.
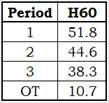
Exhibit E
Looking at this data now, I realize I should have expected the hit rate to reduce as the game goes on. The guys who deliver the most hits usually get less ice time as the game goes on. In 2022-23, Ryan Reaves (NYR, MIN) averaged 9.5 minutes of ice time per game. By period, it would probably break down as 4.5 – 3.5 – 1.5 – 0.0. Hits are down late in the game because players like Reaves are comfortably ensconced on their benches.
Hitting By Score Margin
The next surprise for me was how the score margin in a game affected hitting. The score margin is the size of the lead: a margin of 2 goes with scores like 2-0, 7-5, and 3-1.
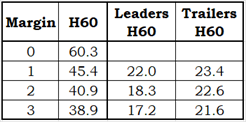
Exhibit F
I had thought that the more a team trailed, the more likely they would be to turn on the hitting, and that their hitting would increase as the margin increased. I went 0-1-1 on those two thoughts.
My loss is that as the score margin increases, hitting actually decreases. My tie is that as the score margin increases, the trailing team hits more frequently than the leading team. They don’t increase their hitting compared to when the score was tied, but they do more hitting than the leaders. I’m probably being a little generous to grant myself a tie there.
Hitting By Score Margin and Period
Hitting in a game becomes less frequent as the game progresses, and it becomes less frequent as the score margin increases. This is true when the two factors are combined, but the driving factor would seem to be game time as opposed to score margin.
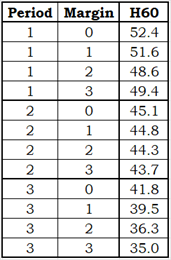
Exhibit G
Hitting in the first and second periods was fairly consistent within each period, regardless of the score margin. In the third period, hitting declined as the score margin increased.
Hitting By Team by Period, Home and Away
This next table should probably have been one of my exhibits in the Judging the Hit Statistics section. It shows hits-delivered-per-60-minutes by New Jersey and Toronto in their home and away games. They delivered almost the same number of hits in their away games but had vastly different hits delivered in their home games.
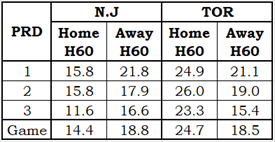
Exhibit H
Some fans of hitting characterize it in emotion-laden terms: teams that hit are tough, and players that hit are brave. One wonders how they would deal with the data from the table above.
They’ll start off with a thought that Toronto sure is tough at home: they deliver ten more hits per home game than the Devils. But how do they deal with the rest of the data? If Toronto is tough at home, are they weaklings on the road? If Toronto is brave at home, are they frightened on the road? Using this emotion-laden terminology, they would have to concede that the Devils are a tougher road team than the Maple Leafs.
They would also have to concede that many teams are tougher than the Leafs at home: Pittsburgh averaged 10.5 more hits per home game than did the Leafs. The Leafs were 12th in the league in hits delivered at home but ranked 28th in hits delivered on the road.
Do the Leafs need to get tougher? Maybe. Do they need Reaves? No, no team needs Reaves. Vegas won the Stanley Cup last season while ranking 24th in hits delivered on the road. Hitting, in and of itself, does not lead to winning.
Hitting by Dimension
The league has many players who are one-dimensional hitters: they do practically nothing but deliver hits. The “Dashboard” chart shows just how one-dimensional these sorts of players can be. Let’s look at the Dashboard of Ryan Reaves (MIN, MYR).
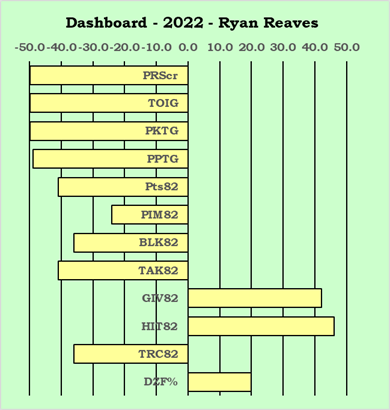
Exhibit I
Bars that go to the left indicate the player was below league average in that area, while bars that go to the right indicate the player was above average. The longer the bar, the farther from average the player is.
Reaves is among the league leaders in delivering hits. He is strangely high in giveaways. Strangely, because you have to actually have the puck in order to give it away.
The league is also full of multi-dimensional hitters. While I was tempted to use Brady Tkachuk (OTT) as my example, I decided to use J.T. Miller (VAN) instead. I wouldn’t want to be accused of boosterism.
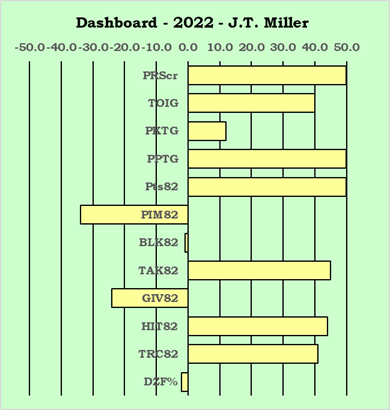
Exhibit J
It’s a very unfair question, but who would choose to have Ryan Reaves on their team instead of J.T. Miller? The unfair answer is: people who are related to Ryan Reaves. But teams are full of players who aren’t as good as J.T. Miller, so why pick on Reaves?
I pick on Reaves because he plays a lot of games and he has a low PR-Score, meaning he doesn’t do much to help his team win. Derek Grant (ANA) played 27 fewer games than Reaves last season, and he clearly had the better season of the two. With almost identical ice time, he had more goals, more assists, almost 300 times more penalty-killing ice time minutes, more faceoff wins, and a better team-relative Corsi.
There are scores of guys in the AHL who are better than Reaves, guys who would do more to help an NHL team win games.
Summary
The hitting statistic is heavily influenced by observer bias in at least eight NHL arenas.
Hitting frequency has been consistent in the NHL since 2016-17.
Hitting frequency drops as the game goes on because many of the players who deliver a lot of hits don’t see much of the ice as the game goes on.
Hitting frequency decreases as the score margin increases. Teams do not see hitting as a tool to help them “get back into the game”, and do not use hitting as a tool to “get back at the opposition.”
There are players who deliver hits and do lots of other things that help a team, and there are other players who just deliver hits. In my humble opinion, the league could do without and would be better off without those one-dimensional hitters. If the league didn’t have “nuclear deterrents”, the league wouldn’t need “nuclear deterrents.”
Related Articles
None.