
If you are a fan of either Montreal or Toronto, you will remember their season-opening game, albeit for different reasons. Toronto outshot Montreal 48-27, yet lost 1-0. Whether you consider the strengths of each team going into the game or the play of the game, this was a winnable game for Toronto.
Terminology
If you see an abbreviation in this article with which you are unfamiliar, you can find its definition in this section.
ixG – Individual Expected Goals – the estimated number of goals a player should have, given the quality and quantity of shots he has taken. At the 4 Nations Cup break, Brady Tkachuk led the league with 27.2 ixG.
ixGA – Individual Expected Goals Against – the estimated number of goals a goalie should have allowed, given the quality and quantity of shots he has been subjected to. Sam Montembault (MTL) led the league with 124.7 ixGA: this is not a category a goalie wants to lead the league in.
xGF and xGA – Expected Goals For and Against – xGF is the sum of a team’s players’ ixG; xGA is the sum of an opposing team’s players’ ixG. The New Jersey Devils led the league in xGF with 194.9, and the Los Angeles Kings led the league in xGA with 141.1 (the smaller the xGA, the better).
iFin – Individual Finishing – a measure of a player’s ability to score, calculated by subtracting his ixG from his goals. Leon Draisaitl (EDM) led the league in iFin at +16.6 based on 40 goals scored and an ixG of 23.4.
iSvAA – Individual Saves Above Average – a measure of a goalie’s ability to prevent opposition scoring, calculated by subtracting his ixGA from his goals against (iGA). Connor Hellebuyck (WPG) led the league with +31.4 ixGA. This is the category a goalie wants to lead the league in.
TmFin and TmSvAA – these are the team level counts for finishing and saves above average. A team can have a good finisher (positive iFin) but still have a negative TmFin if the other skaters are largely negative iFin.
Pts% – the percent of points a team gets in a number of games. A team that has a win and an overtime loss got 75% of the points from two games (3 out of a possible 4 points).
STTB – Stapled To The Bench – a soapbox on the internet where a retired codger spouts off on hockey issues based on the analysis of NHL statistics.
What is a Winnable Game?
There is an adage that “teams should win the games they should win,” that better teams should beat lesser teams. Identifying these games is normally done informally by a pre-game assessment of the strengths of each team. In 2024-25, it means that Winnipeg and Washington should win against Chicago and San Jose.
At STTB, data rules over opinions. The STTB definition of a winnable game is a game where one team had at least +1.00 more xG than their opponents (xGF – xGA >= 1.00).
In the Toronto vs. Montreal game, Toronto had +3.12 xG (6.09 – 2.97), making it a winnable game for Toronto (and a losable game for Montreal).
Player Roles in Winnable Games
Expected goals are generated by forwards and defensemen, so it is the skaters that determine whether a game is winnable. While goalies can not make games winnable, they can be responsible for winning games.
In the cited game, Montreal’s goalie (Montembeault) had an iSvAA of +6.09, giving up six fewer goals than expected. Toronto’s goalie (Stolarz) also had a great game: +1.97 iSvAA.
Shooters can also influence a game. The lack of finishing by the skaters in both Toronto and Montreal was problematic, especially for Toronto. And, of course, there will be games where both goalies and shooters combine to produce a victory out of a game they should have lost.
At the game level, it is impossible to determine whether a goalie was hot or the shooters were cold. Those determinations are best made with season-level data, where great goalies will have good iSvAA season data, and great shooters will have good iFin season data.
Data Being Used in This Article
Wanting to limit this article to recent seasons, I downloaded game data from all manpower situations for the last three full seasons (2021-22 to 2023-24) as well as game data from 2024-25 (up to January 26th, 2025). That gave me data from 4,727 games. My source, as almost always, was naturalstattrick.com.
The Big Picture of Winnable Games
There were 2,258 winnable games, ones where one team had an xG of +1.00 or more. The combined record of those teams was 1,627 – 461 – 170. The teams that should win got 1.52 points per game, earning 76% of the available points.
This information provides us context for teams: a league average team would have 19 winnable games a season and get 76% of the points in those games, which is the equivalent of a 14-4-1 record.
Winning Winnable Games – Leaders and Trailers
The reason that only a subset of teams is shown in the following tables is that I’m old. My mind focuses on the appearance of the paper version of an article, and the full table of 32 teams would take up too much space: it would be a “wall of numbers.” As the interesting parts of most lists are at the extremes, I’ll show the extremities.
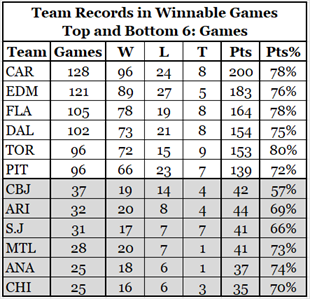
One thing is immediately clear and totally expected: better teams play more winnable games. Carolina had 100 more winnable games than Anaheim, Montreal and Chicago.
On average, Carolina had 35 winnable games per season, and Edmonton had 34, while Anaheim and Chicago had 7.
Did you notice that two of the teams that had the lowest number of winnable games had a better Pts% than Pittsburgh? That is probably caused by a small sample size. Speaking of Pts%, let’s look at the extremities of that list.
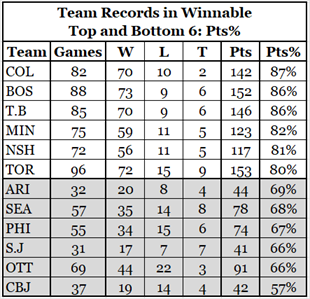
The top three teams are the best teams in the league at winning winnable games. When they outplay their opponents, it’s almost game over.
They don’t generate as many winnable games as the top teams in the previous list, but they are more efficient at converting their winnable games into standing points.
It was sad, but not unexpected, to see Ottawa in the bottom six. (The author is a fan of the Ottawa Senators.) Expected goal data encapsulates the frustrations of Senator fans: the team plays better than their record indicates, and they lose games they should have won.
Not only did Ottawa do badly at winnable games, but they also did badly at losable games. Their record in games where their opponents had at least a 1.00 advantage in expected goals was 9-41-9, giving them a Pts% of 23%. The league average was 34%.
Why do Teams do Better at Winning Winnable Games?
Why has Colorado done so well at winning winnable games (Pts% = 87%), and why did Columbus do so poorly (Pts% = 57%)? It is because games are decided by actual goals, not expected goals. Expected goals estimate scoring based on average shooters and average goalies, and not every team has average shooters and average goalies.
A team with a couple of excellent finishers will score more goals than expected. A team with an excellent goalie will give up fewer goals than expected. In both situations, teams will get better game results than the expected goal data indicates. Teams with poor shooters and/or poor goalies will get worse game results than the expected goal data indicates.
Determining Team Finishing and Goaltending
Expected goals are an excellent indication of actual goals, but the match is not precise. The total expected goals over the period used in this article is 98.8% of the total actual goals: expected goal estimates are ever so slightly pessimistic.
I wanted the expected goal data to be very close to the actual goal data, so I multiplied each team’s expected goals for and expected goals against by 1.0123 (the inverse of .988). After this modification, the total goals were 29,221, and the total expected goals were 29,220. That’s close enough for government work!
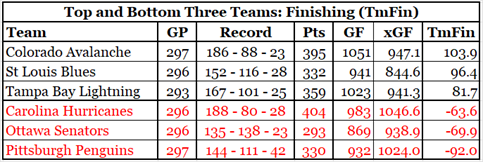
A team’s shooting quality (team finishing, TmFin) is the difference between their goals scored and their expected goals scored (TmFin = GF – xGF). A positive number means your team was more efficient at scoring. The top and bottom three teams are shown below.
A team’s goaltending quality (team saves, TmSav) is the difference between their expected goals against and their goals against (TmSav = xGA – GA). A positive number means your team’s goaltending was more efficient at preventing goals. The top and bottom three teams are shown below.
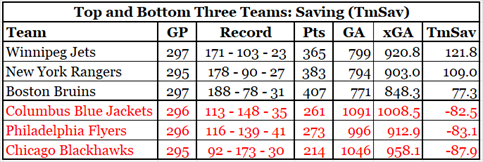
If the top three teams in TmSav were any other teams, it would be impossible to believe the statistics. Those teams were blessed with exceptional goaltending in the last three full seasons.
I ranked the teams in both TmFin and TmSav. Here is a table with the top and bottom three teams in combined rankings of TmFin and TmSav.
The strength of Colorado and Tampa Bay has been their finishing, while Boston’s strength has been their goaltending.
San Jose has been very weak at finishing and goaltending; Ottawa has been very weak at finishing and moderately weak at goaltending. Columbus has been very weak at goaltending but has been above average at finishing.
Columbus’s TmFin data is unexpectedly high. They scored more than expected (good TmFin data), but they weren’t expected to score much (24th in the league in xGF).
Ottawa’s Surprising Results
Ottawa fans would be surprised to see Ottawa has a bigger problem at finishing than at goaltending. The Senators are the gang that can’t shoot straight, and the leader of that gang is Brady Tkachuk. In this period of games, Tkachuk leads Ottawa with 122 goals but also leads with 156.6 ixG: Tkachuk’s iFin is -34.6. The lowest-rated Ottawa goalie in terms of iSvAA is Mads Sogaard at -19.6. Tkachuk’s lack of finishing has cost Ottawa more wins than any of their goalies have.
The local media has been quick to throw shade at Ottawa’s goalies over the seasons, and it is true that they have given up more goals than they should have. Yet the local media is mum on Tkachuk’s shooting woes. Are they blinded by the fact that he scores a lot? Do they think that almost every goalie he faces plays a good game against him? Do they not see him shoot the puck into the goalie’s pads?
It is absolutely true that Tkachuk scores a lot: he is averaging 34 goals per 82 games played since 2021-22. His expected goal data indicates he should be scoring 43 goals per 82 games.
Traditional Definition of Winnable Games, With Data
I briefly looked for a data source that would provide a pre-game look at each team’s strengths: betting web sites. While I detest sports betting, data are data, and pre-game odds would seem to be a good indicator of which team should win.
I found a site from which historic pre-game betting information could be extracted, but the process was manual, so it was laborious. I copied data from this season’s opening month and played with it for a bit. It was obvious that the data could be interpreted to highlight games where one team was a significant favourite over the other, which would be a data-driven way to identify games that teams should win based on pre-game data.
Further research was called off largely due to the effort involved in getting the data.
Summary
A winnable game, based on either a game-level difference in expected goals or on the pre-game betting line, is not a sure-fire win.
Upsets happen. If teams won games every single time they were supposed to, there would be no betting industry.
Canada won the 4 Nations Cup 3-2 last night. Foxtrot Delta Tango!
Related Articles