
Around forty years ago, Bill James (a baseball analyst) wrote an article which mentioned player turnover on major league baseball teams. I thought I’d do the same for hockey. This article will look at various aspects of the season-to-season consistency of a team’s main group of players.
Somewhat obviously, I needed a numeric way to identify the “main group” of players on the team. Numeric, because I didn’t want to identify main players on an emotion-led basis.
Identifying The Main Group of Players on a Team
I decided that the main group of players would be ten players: the top four defensemen and top six forwards. I didn’t want guys like Wayne Simmonds (Toronto) and Austin Watson (Ottawa) to be considered part of the main group of a team.
There were two options for identifying the top players on a team: those who played the most time, or those who had the highest Productivity Rating (PR). The good news is that 98.3% of the time, a top-time player is also a top-PR player. Where there is disagreement, it’s at the fourth defenseman (D4) and sixth forward (F6) level.
I looked at many cases where different players were identified, and it struck me that the differences were usually caused when a very good player was injured for a long period of time. Because of the injury he missed time on ice, but because of his talent he had a higher PR-Score than the guy who played more. Who was more the main player in a season: a player who played all 82 games, or a player who missed 34 games due to injury? To me, the answer was that it was the guy on the ice.
Counting Consistency – An Example
The following table shows the main group players for the New York Islanders for the 2017 and 2018 seasons. Players are ordered by position and time-on-ice (highest to lowest); also shown is the player’s PR-Category for the season.
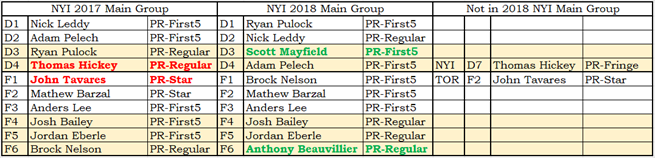
Players in red font in 2017 were not in the main group in 2018, while players in green font in 2018 were not in the main group in 2017. The third set of columns shows the 2018 information of players who were not in the NYI 2018 main group.
Eight players from the Islanders 2017 main group were in their 2018 main group. Hickey missed a lot of games in 2018 which reduced his playing time. Tavares had packed his jammies and wended his way to Toronto after the 2017/2018 season ended, where he was in their top ten group.
Main Group Consistency at the League Level
On average, only six of a team’s ten top players in one season are also in the top ten in the subsequent season. The average team introduces four new players to its main group each season. I found this to be surprisingly low, and injuries to players is no small part of the reason the main group changes. The following chart shows the frequency distribution of how many players were in the main group two seasons in a row.
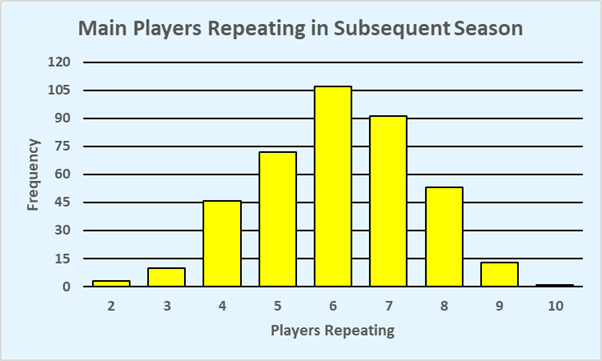
There are 396 teams in this study, and in one instance did a team have the same ten players in consecutive seasons. Three teams had only two players repeat in their top ten the subsequent season.
One of the two-repeater teams was the 2009/2010 Pittsburgh Penguins.
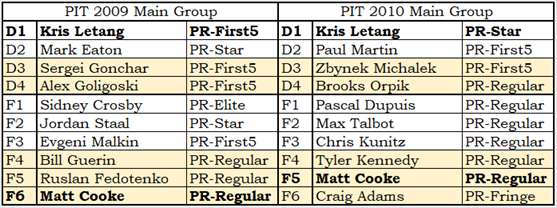
As to the defensemen: Mark Eaton played with the Islanders in 2010; Sergei Gonchar played in Ottawa, and; Alex Goligoski was traded to Dallas during the season. Had the Pens traded Goligoski three games later into the season, he would have been their fourth most used defenseman.
Sidney Crosby played half a season (41 games) and was actually Pittsburgh’s best forward according to Productivity Rating. Staal played one more game (42) than Crosby, and Malkin played one more game (43) than Staal. Ruslan Fedotenko plied his trade for the New York Rangers, and Bill Guerin retired.
It should be a bad omen if Matt Cooke is a top-six forward for you. It should be a terrible omen if he is the only top-six forward to repeat. But the 2010 Penguins had a 106-point season, a five-point improvement over 2009. They relied on defense in 2010, giving up 38 fewer goals than the season before.
Main Group Consistency by Team’s Level of Success
There is a small difference in consistency based on a team’s level of success. The worse the former season was, the fewer players were retained in the second season. It makes sense.
I looked at main group consistency by the record of the team. A team’s season was put in one of five categories: Great (104 or more points), Above Average (97 to 103 points), Average (89 to 96 points), Below Average (79 to 88 points), Poor (78 or fewer points). Each group contains about 20% of the 396 teams in the analysis.
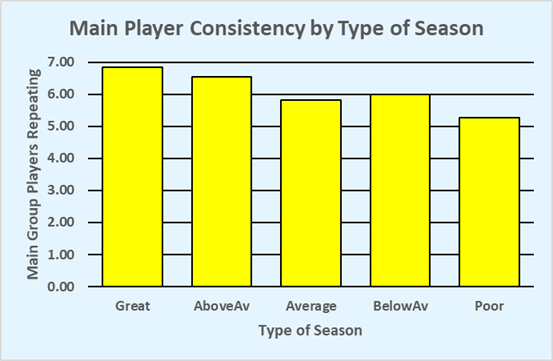
Coming off a great season, a team on average retains 6.85 of its top ten players. After an above average season, 6.55 players are retained. As seasons worsen, the number of players retained goes from 5.81 to 5.99 to 5.26.
That the average number of retained players for the below average teams is slightly higher than it is for the average team can be attributed to randomness.
Good teams keeping players is somewhat to be expected, based on two sports adages that cover all professional leagues: “don’t fix what ain’t broken”; “we won with these guys last year, didn’t we?”
A team that just had a poor season will tend to bring in new players for exactly the opposite reasons. The team situation is broken, and they didn’t win with these guys last year. Poor teams must shake up the line-up to rise up the standings.
Recap
On average, only six of a team’s top ten players remain top-ten players for that team the following season. Turnover is higher for teams that had bad seasons than for those that had good seasons.