
There is an adage in hockey as old as Cyclone Taylor’s jock strap: you can’t win unless you play defense. On its broadest level, it is obviously true, just as it is obviously true that you can’t win unless your players have sticks and skates.
Having busted a couple of hockey myths recently (trap games; young players play worse on the road than older players), I figured I’d bust this myth as well.
The basic question is: What role does defense play in a winning team?
Data
The data for this study is the final standings of the last fifteen seasons. Since I can only go back fifteen seasons for player data, I’ll use that time period for this study as well.
Average Goals For and Goals Against
In the last fifteen seasons, there have been 35,188 regular season games in which a total of 100,557 goals have been scored. That’s an average of 2.86 goals per game per team.
Two percent of those goals (1,923 of the 100,557) were awarded as a result of a shoot-out victory, so the actual average team score is 2.81 goals plus 0.05 shoot-out victories. It would be pedantic to worry about 0.05 goals, and even if I did “handle” it, the results of the analysis would not change: I choose to not worry about shoot-out victory goals in this analysis.
The following table shows the average score of all 456 teams (row 1), and then shows a breakdown of playoff teams and non-playoff teams (rows 2 and 3). The “Dif” in the last two rows is the difference between the group’s average and the average of all teams: playoff teams score 0.16 more goals per game on average than do all teams.
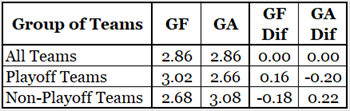
Playoff teams were not as far off average as non-playoff teams because slightly more teams have made the playoffs in the last fifteen seasons than have missed. If exactly half of the teams made the playoffs each year (which was impossible when the league had 31 teams), the Dif would be identical but opposite for playoff and non-playoff teams.
The data indicates that defense is slightly more important than offense. In an 82-game season, a playoff team will score 13 more goals than the league average and will give up 16 fewer goals. Over 82 games, the difference is 3 goals: it is a slight difference.
Team Records with Good Offense or Good Defense
159 teams had a good offensive season, where they were more than 0.1 goals above average (above 2.96 goals for per game). Those teams made the playoffs 130 times, which is 82%.
179 teams had a good defensive season, where they were more than 0.1 goals below average (below 2.76 goals against per game). Those teams made the playoffs 154 times: 86%.
When it came to making it as far as the conference championship series (the last four teams in the playoffs), the good defensive teams did it 24% of the time, while the good offensive teams did it 23% of the time.
Good defensive teams were 4% more likely to make the playoffs, and 1% more likely to make the conference championship round. That is another slight edge to defense.
Making it to the Conference Finals
The average game score of a playoff team was 3.02-2.66. Teams that made it to the Conference finals had an average score of 3.04-2.61 (+0.43 goals per game), while playoff teams that did not make it to the Conference finals had an average score of 3.01-2.68 (+0.33 goals per game).
Yet another slight nod to the defense.
Percentiles
I grouped teams by their offensive and defensive percentiles. A team was in the first offensive group if they averaged better than 3.30 goals for per game, in the second offensive group if they averaged better than 3.13 goals for per game, and in the third group otherwise. On defense, the groups were determined by teams that averaged less than 2.44 goals against per game, then less than 2.56 goals against per game, then everybody else. Each of the top two groups would have about 10% of the teams, while the unwashed masses (the third group) would hold about 80% of the teams.
The offensive first group had 44 teams and made the playoffs 41 times (41-3). The defensive first group was 43-0. The second groups were 37-10 on offense, 41-7 on defense. The catch-all groups were 162-203 and 156-209, offense noted first.
Once again, a slight nod to the defense.
Myth: Confirmed, Slightly
Before I start a study, I usually have an opinion as to what it will show. I was fairly confident this myth would be busted, that the study would show that offense was just as important as defense. My opinion was incorrect.
The data indicates that defense is a little more important than offense. Slightly more. Very slightly more. In the same sense, it is better for a basketball player to be 6’ 9” instead of 6’ 8”, and it is better if your baseball batting average is .314 instead of .312.
How slight is the difference? Let’s take a look at two hypothetical teams. One outscored their opponents 260-235 in the regular season, the other outscored their opponents 240-215. Both teams outscored their opponents by 25 goals, but the more defensive team gave up 20 fewer goals (and also scored 20 fewer goals). Using the Pythagorean formula for hockey to estimate their standing points, the defensive team should get 100 points, while the offensive team should get 99 points.
The difference between the two hypothetical teams is one standing point. That’s slight.
It doesn’t bother me at all that my opinion on the subject of defense was wrong. I’m human, and I make mistakes all the time. I am happy that I was able to investigate this issue and learn that defense is (slightly) more important than offense. The data spoke, and I listened.
As I stated in an earlier article, I do not select hockey statistics that support my opinions; I use hockey statistics to investigate a question on which I may have an opinion.
Rabid fans and lazy sports media will do the former. They would say something like “Boston outhit Arizona and won the game, that proves that hitting is important”. No, it doesn’t. That’s one game, and it involved a very good team and Arizona. There have been 35,188 regular season games. If I were going to evaluate the importance of hitting, I’d look at how often a team wins when they outhit their opponent using all of the games in at least one full season. Which I’ve already done, by the way (see the article Team Results List).
When a team outhits their opponents by 10 or more, their total record was 151-161-41. When a team is outhit by their opponents by 10 or more, their record was 202-121-30. The “hits are valuable” myth is busted. Now I can go to sleep happily.